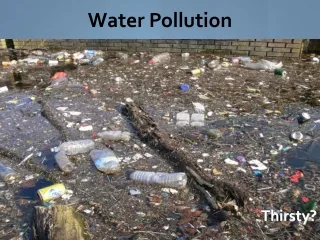
Water Pollution
Water Pollution . Chapter 19. What is water pollution?. Any chemical, biological, or physical change in water quality that has a harmful effect on living organisms or makes water unsuitable for desired uses. How do we measure water quality?.

Water Pollution
E N D
Presentation Transcript
Water Pollution Chapter 19
What is water pollution? • Any chemical, biological, or physical change in water quality that has a harmful effect on living organisms or makes water unsuitable for desired uses.
How do we measure water quality? • Fecal coliform test – measure number of colonies of coliform bacteria present in a 100 ml sample of water • WHO recommends a coliform count of 0 colonies/100 ml for drinking water • EPA recommends a maximum of 200 colonies/100 ml for swimming water
BOD test – Biological oxygen demand • The amount of oxygen demanding wastes in water • The amount of dissolved oxygen needed by aerobic decomposers to break down the organic materials in a certain volume of water • Take a sample of the effluent – aerate it • Run a DO test • Put the sample in the dark at 20 0 for 5 days • Run another DO test • The difference is the BOD
Use chemical analysis • Hach kits • Determine the presence and concentrations of most organic and inorganic chemicals that pollute water
Use Indicator species to monitor water pollution • Can analyze tissues of organisms found in water • Can also make a count of the number of different types of organisms and this will give you an indication of water quality.
Water Quality Do (ppm) at 20˚C Good 8-9 Slightly polluted 6.7-8 Moderately polluted 4.5-6.7 Heavily polluted Below 4.5 Gravely polluted Below 4
Freshwater streams and rivers • Water that flows that recover fairly rapidly from degradable oxygen-demanding wastes and thermal pollution • Does this by a combination of dilution • “dilution is the solution to pollution” • And bacterial decay • This works as long as the stream is not overloaded with pollutants and something does not reduce the flow of the stream (damming, drought, etc.)
Breakdown of degradable wastes depletes dissolved oxygen • This reduces or eliminates populations of organisms with high oxygen requirements until the stream is cleansed of wastes
Clean Zone Decomposition Zone Septic Zone Recovery Zone Clean Zone Normal clean water organisms (trout, perch, bass, mayfly, stonefly) Trash fish (carp, gar, leeches) Fish absent, fungi, sludge worms, bacteria (anaerobic) Trash fish (carp, gar, leeches) Normal clean water organisms (trout, perch, bass, mayfly, stonefly) Types of organisms 8 ppm 8 ppm Dissolved oxygen Oxygen sag Concentration Biological oxygen demand 2 ppm Direction of flow Point of waste or heat discharge Time or distance downstream Oxygen sag curve
Time and distance for a stream to recover depend on • Volume of stream • Flow rate • Temperature • Ph • Can also get an oxygen sag curve from thermal pollution
Laws passed since 1970’s have increased number of wastewater treatment plants Industry is required to clean up their waste or be fined Still have fish kills and drinking water contamination In developing countries there is little waste treatment Good news/Bad news
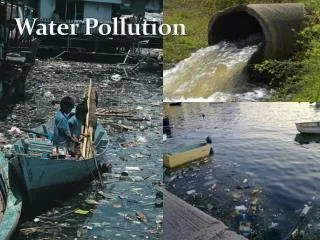
Rivers provide many ecological services • Major threats to rivers are • Pollution • Disruption of water flow • overfishing River pollution Killer algae
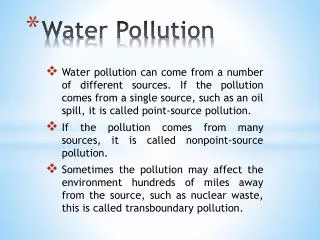
POINT DISCHARGE POLLUTANTS AT SPECIFIC LOCATIONS PIPES, DITCHES, SEWERS CAN BE: Factories, sewage treatment plants, mines, oil tankers EASY TO IDENTIFY, MONITOR, AND REGULATE NONPOINT CANNOT BE TRACED TO A SINGLE SITE OF DISCHARGE CAN BE: Acid deposition, runoff from lawns, farms, logged forests, golf courses, ets DIFFICULT TO IDENTIFY SOURCE AND CONTROL EPA ESTIMATES THEY ACCOUNT FOR 64% OF POLLUTANTS ENTERING STREAMS AND 57% IN RIVERS SOURCES OF POLLUTION
Municipal sewage treatment plant? Pesticide runoff from farms Sediment runoff from a construction site Dyes from a textile mill Sediment runoff from logging Oil spill from a leaking pipeline Dioxin from a paper mill Mining runoff Groundwater contamination from a landfill Waste oil from a do-it-yourselfer oil change poured in a ditch Thermal discharge from a power plant Which would the following be?
Which would the following be? • Municipal sewage treatment plant? point • Pesticide runoff from farms non-point • Sediment runoff from a construction site - nonpoint • Dyes from a textile mill -point • Sediment runoff from logging – non-point • Oil spill from a leaking pipeline - point • Dioxin from a paper mill - point • Mining runoff – non-point • Groundwater contamination from a landfill – non-point • Waste oil from a do-it-yourselfer oil change poured in a ditch - point • Thermal discharge from a power plant - point
Pollution of freshwater lakes • Dilution does not work as well as in running water • Often contain stratified layers with little mixing • Have little flow – can take up to 100 years to flush a lake or reservoir • Ponds contain small volumes of water • Much more vulnerable to pollution by: plant nutrients, oil, pesticides, and heavy metals • Can kill bottom life, fish and birds
Water 0.000002 ppm Phytoplankton 0.0025 ppm Herring gull 124 ppm Herring gull eggs 124 ppm Zooplankton 0.123ppm Lake trout 4.83 ppm Rainbow smelt 1.04 ppm Biological magnification
Cultural eutrophication • Eutrophication – natural nutrient enrichment of lakes • Cultural eutrophication – accelerating the input of plant nutrients to a lake • Caused by nitrate and phosphate – containing effluents • Causes algal blooms and fish kills • Can be prevented by: advanced wastewater treatment, bans on phosphates in detergents, soil conservation to reduce run-off • Clean-up – remove excess weeds, use herbicides and algicdes, aerate lakes and reservoirs
Groundwater pollution • Sources: storage lagoons, septic tanks, landfills, hazardous waste dumps, deep injection wells • We also store gasoline, oil, solvents, and hazardous wastes in metal underground tanks that can leak over time • High health risks in drinking water – mainly from petrochemicals, organic chlorides, pesticides, arsenic, lead, and fluorine
Cannot cleanse itself • Moves very slowly • Does not have many decomposing bacteria • Cold temperatures slow down chemical reactions that decompose wastes • Degradable wastes take hundreds to thousands of years to clean up • Nondegradable wastes never clean up. • We don’t know the extent of groundwater pollution
How to protect groundwater • Monitor aquifers near landfills and underground tanks • Require leak detection systems for underground tanks • More strictly regulate disposal of hazardous wastes • Store hazardous liquids above ground
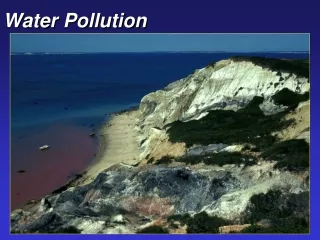
Ocean pollution • Oceans are the ultimate sink for much of our waste that we produce • Mainly affected are the coastal areas • More people live there • Developing countries dump sewage and industrial wastes in without treatment
What happens… • Humans get ear infections, sore throats, respiratory disease and gastrointestinal disease • Algal blooms are caused by nutrient run-off • Deplete the dissolved oxygen and get OXYGEN DEPLETED ZONES – aquatic life dies or moves
What do we dump? • DREDGE SPOILS- materials from bottoms of harbors and rivers – often contain toxic metals etc. • SEWAGE SLUDGE – leftover from wastewater treatment • LONDON DUMPING ACT – 1972 • 100 countries agreed not to dump highly toxic pollutants and radioactive wastes in the opean sea
Oil in the ocean • Crude petroleum and refined petroleum are accidentally or deliberately released • Released during normal operation of offshore wells • Washing tankers and releasing oil water • Pipelines and storage tank leaks • Much comes from land (about 50 - 90%) • About 10% comes from atmosphere from smoke from oil fires
Effects • VOC’s kill at once • Other chemicals coat feathers and fur – animals lose natural insulation and buoyancy and drown or die from hupothermia • Some smothers bottom dwellers and kills them or makes the unfit for human consumption
How to clean up: • MECHANICAL METHODS: • FLOATING BOOMS • SKIMMER BOATS • ABSORBENT PADS • CHEMICAL METHODS: • COAGULATING AGENTS - CLUMP • DISPERSING AGENTS – BREAK UP SLICKS
PREVENTING & REDUCING SURFACE WATER POLLUTION • NONPOINT SOURCES: • REDUCE FERTILIZER RUNOFF BY USING SLOW RELEASE FERTILIZERS • PLANT CROPS WITH ALTERNATING ROWS OF ROW CROP AND NITROGEN-FIXING PLANTS • PLANT BUFFER ZONES BETWEEN CROPS AND WATER SOURCE • USE PESTICIDES ONLY WHEN NEEDED NOT AS A PREVENTATIVE • CONTROL RUNOFF FROM FEED LOTS • PRESERVE RIPARIAN ZONES AND CREATE NEW ONES • REDUCE SOIL EROSION BY REFORESTING WATERSHEDS
REDUCING POINT SOURCES – THE LEGAL APPROACH • CLEAN WATER ACT – 1972 - SURFACE WATERS • MAKE THEM ALL SWIMABLE, FISHABLE, AND DRINKABLE • BEFORE THIS MANY CITIES EVEN IN THE U.S. STILL DISCHARGES THEIR WASTE INTO WATERWAYS OR MINIMAL TREATMENT • MAIN GOAL WAS TO IMPROVE WASTEWATER TREATMENT
GOOD Has improved wastewater treatment facilities and more people have them Has reduced topsoil runoff Has reduced wetland loss About 44% of lakes are still unsafe for fishing and swimming Animal wastes pollute most of our rivers Much toxic waste is dumped illeagaly each year Many lake fish are not safe to eat We are still losing much of our wetlands. GOOD NEWS/BAD NEWS
Discharge trading policy • 1995-EPA • Put into effect as a pilot program in 2002 • Allows water pollution sources to pollute as higher levels than allowed in their permits by buying credits from permit holders with pollution levels below their allowed levels!