Download
1 / 25
250 likes | 438 Vues
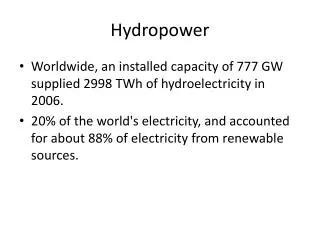
Managing the Business of Hydropower. 2008-06-02 Nils Andersson, Vattenfall Group Function Communication. Globalisation. Security of Supply. The functioning of EIM. Technology. Climate Change. Challenges. Hydropower fits well. GWh/ vecka. Springtime flood-snow melting. 4000. Wet year.

E N D
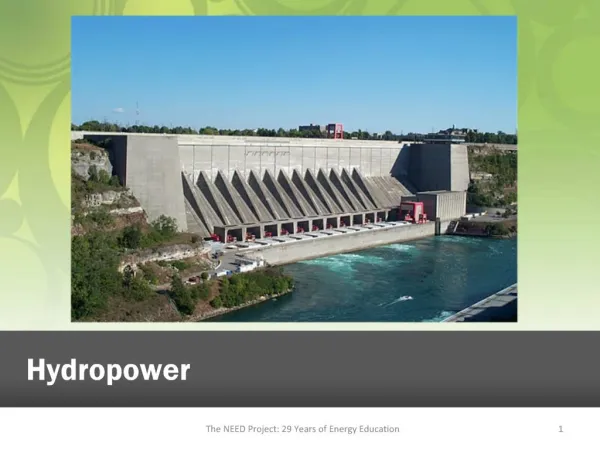
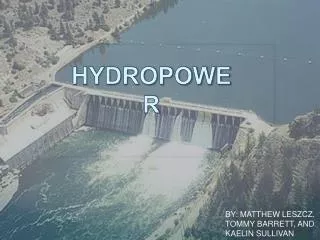
Managing the Business of Hydropower 2008-06-02 Nils Andersson, Vattenfall Group Function Communication
Globalisation Security of Supply The functioning of EIM Technology Climate Change Challenges Hydropower fits well
GWh/ vecka Springtime flood-snow melting 4000 Wet year Normal year 3000 Dry yearr Winter persipitation as snow and ice 2000 Inflow 1000 Winter-high electrisity demand Summer-low Electrisity demand GWh/ vecka 2000 Demand of electrisity 1000 Filling reservoirs Redusing reservoirs GWh/ vecka Inflow 3000 Normal hydroyear production 2000 Reservoir use Long term regulation 1000 Hydropower in the Nordic Region Maj Jun Jul Aug Sep Oct Nov Dec Jan Feb Mar Apr
Pricing of Electricity • Before DeregulationPrice = Cost + Profit • After DeregulationProfit or Lost = Price – Cost Security of Supply Calculations Market Price
The Fundamentals of the Electricity Market • Electricity is a very homogeneous product when using it, and is therefore easy to put under competitionWhen using it is not possible to differ from which source the electricity is comming. The costs and the environmental impact on the other hand are very heterogenous • Transport costs are normaly paid via nettariffsInside different price areas the market price does not include any transport costs • Marginal Cost Pricingis not a price model but the result of good competition Price uncertainty
Nord Pool sets the Spot Price on the Nordic Market Price Supply Demand Volume • Here producers and consumers meet • The spotprice is set where supply and demand curves meet • The spot price is set every hour • The spot price reflects the marginal cost for the total system.
Hydropower Inflow - Norway & Sweden Maximum variation in inflow (50 yaers) = 90 TWh Maximum production in Nordic nuclear = 90 TWh 220 TWh/year 200 180 160 140 120 100 1950 1955 1960 1965 1970 1975 1980 1985 1990 1995 2000
€/MWh Gasturbines and”peak hydro” 80 demand 60 ETS 20€/t 40 Supply and demand meet oil 20 Hydro & coalcondensing wind nuclear run of river hydro 0 TWh/år (capacity) 100 200 300 400 CHP Market Price – normal hydro conditions
Balance regulation &balance settlement Day before delivery Day of delivery Day after delivery Hour of delivery 12.00 12.00 Balance settlement Balance power Spot market Balance regulation Regulation power - automatic - called bids Commercial trading
Bids on the spot marked Price Quantity Buy Quantity Sell
Prices/Turnover Price Buy Sell System price Quantity Turnover
Value chain – internal interface Financial market (OTC, NordPool, ..) PD VAB int brokerSupply & Trading GenerationVAB shares 37 TWh 33 TWh+/- 6 TWh VABSales End customer Spot market(Nordpool...) Competitors – Sales
Future trading • To limit the risk with Vattenfall Generation portfolio • Futures and forwards • All handled via Vattenfall internal “Electricity Bank” where Electricity Sales can also trade • NordPool, brokers and bilateral • In real time all future contracts are “cleared” against NordPool physical spot prices
Physical responsibility Svenska Kraftnät is responsible for the system • Primary control, frequency, instantaneous reserves • Secondary control, interchange area error • Disturbance reserve • Voltage control • Other ancillary services • Basically through agreements for utilization • Owns gas turbines for fast disturbance reserve
Secondary control • Handled by Svenska Kraftnät Balance Service • Bids for UP- and DOWN-regulation during the hour • Full regulation within 10 minutes (fast regulation = 5 minutes) • Requested regulation results in Requested regulation power, which is included in the settlement procedure • Necessary regulation gives the price for Balance power
Balance regulation - physical balance Price (SEK/MWh) Regulation price (up)If down-regulation calledsame for all called Bids for regulation Market price Volume (+ MW) (– MW) Regulation price (down)If down-regulation calledsame for all called
Prices - regulating & balance power Balance settlement Balance regulation Price (SEK/MWh) Price (SEK/MWh) Market price – MW + MW – MW + MW Regulation price up or down
Primary control • Handled by Svenska Kraftnät Balance Service • Demand in Sweden 2500 MW/Hz and approximately 600 MW momentary reserve • Bids for frequency control capacity + reserve capacity are given by producers • weekly bids (for all hours next week) • hourly bids for the following 24 hours • Automatic regulation power is calculated in the settlement procedure
Measurement • Network companies are responsible • Measurement of physical components: • Generation • Consumption • Interchange toward neighboring network areas • All measured values are used in the settlement procedure • November 1999: Small consumers can switch suppliers using profiles and not hourly measurements
Denmark -5,6 TWh Wind 2,7 Decommissioning ofcoal condensing units -11,9 CHP, condensing 3,6 • Finland11,4 TWh • Wind 0,3 • Hydro 0,3 • CHP* 3,7 • Nuclear 12,0 • Decommissioning of • coal condensing units -4,9 Sweden23,3 TWh Wind 5,5 Hydro 1,7 Nuclear power upgrading 9,0 Natural gas CHP* 2,0 Biofuel CHP* 5,1 Decommissioning of nuclear units 0 • Norway18,0 TWh • Wind 3,5 • Natural gas 8,7 • Hydro 5,8 Changes in Base Power 2007 – 2015 47,1 TWh Increased electricity use 19,7 TWh * CHP and back-pressure generation
Generation capacity and consumption in the Nordic countries The generation capacity does not include the contracted import from Russia and Estonia, about 11-15 TWh/year, and export to other countries.
2008-06-02 Nils Andersson, Vattenfall Group Function Communication Managing the Business of Hydropower Thank you!