1 / 1

Supplementary Figure 1

Supplementary Figure 1. Percentage of short telomeres. p =0.278.

ataret
Télécharger la présentation

Supplementary Figure 1

An Image/Link below is provided (as is) to download presentation Download Policy: Content on the Website is provided to you AS IS for your information and personal use and may not be sold / licensed / shared on other websites without getting consent from its author. Content is provided to you AS IS for your information and personal use only. Download presentation by click this link. While downloading, if for some reason you are not able to download a presentation, the publisher may have deleted the file from their server. During download, if you can't get a presentation, the file might be deleted by the publisher.

E N D

Presentation Transcript


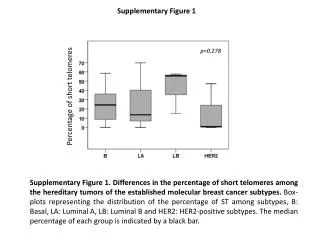
  1. Supplementary Figure 1 Percentageof short telomeres p=0.278 Supplementary Figure 1. Differences in the percentage of short telomeres among the hereditary tumors of the established molecular breast cancer subtypes. Box-plots representing the distribution of the percentage of ST among subtypes, B: Basal, LA: Luminal A, LB: Luminal B and HER2: HER2-positive subtypes. The median percentage of each group is indicated by a black bar.

More Related