Download
1 / 85
850 likes | 999 Vues
Probability Models for Distributions of Discrete Variables. Randomly select a college student. Determine x , the number of credit cards the student has. x = # of cards p ( x ) = probability of x occurring. A population is a collection of all units of interest.

E N D
Randomly select a college student. Determine x, the number of credit cards the student has. x = # of cards p(x) = probability of x occurring
A population is a collection of all units of interest. Example: All college students A sample is a collection of units drawn from the population. Example: Any subcollection of college students. Probabilities go with populations. Scientific studies randomly sample from the entire population. Each unit in the sample is chosen randomly. The entire sample is random as well. Populations / Samples
For discrete data, a population and a sample are summarized the same way (for instance, as a table of values and accompanying relative frequencies). A probability distribution (or model) for a discrete variable is a description of values, with each value accompanied by a probability. Probability Models and Populations
Definitions of Probability 2. the probability of an event is the long term (technically forever) relative frequency of occurrence of the event, when the experiment is performed repeatedly under identical starting conditions. 3. The probability of an event is the relative frequency of units in the population for which the event applies. To aggregate these meanings: The probability associated with an event is its relative frequency of occurrence over all possible ways the phenomena can take place. Probability Models and Populations
“All models are wrong. Some are useful.” George Box -industrial statistician Probability Models
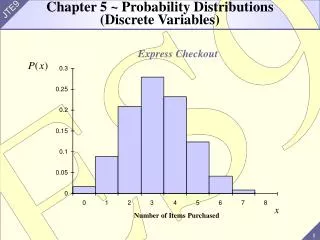
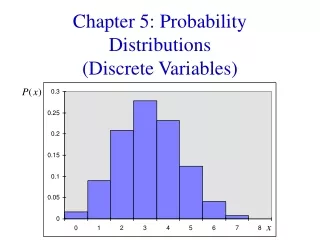
A probability distribution for a discrete variable is tabulated with a set of values, x and probabilities, p(x). Probabilities Must be nonnegative.
A probability distribution for a discrete variable is tabulated with a set of values, x and probabilities, p(x). • Probabilities • Must be nonnegative. • Must sum to 1. • Within rounding error.
The mean of a probability distribution is the mean value observed for all possible outcomes of the phenomena.
Idealized data set n = 100 0 0 0 0 0 0 0 0 0 0 0 0 0 0 0 0 0 0 0 0 1 1 1 1 1 1 1 1 1 1 1 1 1 1 1 1 1 1 1 1 1 1 1 1 1 1 1 1 1 1 2 2 2 2 2 2 2 2 2 2 2 2 2 2 2 2 2 2 2 2 3 3 3 3 3 3 3 3 3 3 3 3 3 3 3 4 4 4 4 4 4 4 4 4 4 5 5 5 5 5 Mean = 1.80 SD = 1.44
Idealized data set n = 1000 0 0 0 0 0 0 0 … 0 (200) 1 1 1 1 1 1 1 1 1 1 … 1 (300) 2 2 2 2 2 2 … 2 (200) 3 3 3 3 … 3 (150) 4 4 … 4 (100) 5 … 5 (50) Mean = 1.80 SD = 1.44
Values for the mean and standard deviation don’t depend on the number of data values; they depend instead on the relative location of the data values – they depend on the distribution in relative frequency terms.
The mean of a probability distribution is the mean value observed for all possible outcomes of the phenomena. Formula: is synonymous with “population mean” SUM symbol Greek letter “myou”
Multiply each value by its probability Sum the products Mean = 1.80
The standard deviation of a probability distribution is the standard deviation of the values observed for all possible outcomes of the phenomena. Formula: denotes “population standard deviation” Greek letter “sigma”
0 0 0 0 0 0 0 0 0 0 0 0 0 0 0 0 0 0 0 0 1 1 1 1 1 1 1 1 1 1 1 1 1 1 1 1 1 1 1 1 1 1 1 1 1 1 1 1 1 1 2 2 2 2 2 2 2 2 2 2 2 2 2 2 2 2 2 2 2 2 3 3 3 3 3 3 3 3 3 3 3 3 3 3 3 4 4 4 4 4 4 4 4 4 4 5 5 5 5 5 Mean = 1.80 SD = 1.44 Mean – SD = 0.56 Mean + SD = 3.24 65 / 100 = 65%
Mean = 1.80 SD = 1.44 Mean – SD = 0.56 Mean + SD = 3.24 0.30 + 0.20 + 0.15 = 0.65
x = # children in randomly selected college student’s family.
x = # children in randomly selected college student’s family. 0.2194 = 21.94% of all college students come from a 1 child family.
Guess at mean? Above 2 (right skew mean > mode).
To determine the mean, multiply values by probabilities, xp(x) and sum these. 55/10 = 5.50 is not the mean 1.000/10 = 0.10 is not the mean
To determine the variance, multiply squared deviations from the mean by probabilities, (x – )2p(x) and sum these.
The standard deviation is the square root of the variance. Examining the data set consisting of # of children in the family recorded for all students: The mean is 2.743; the standard deviation is 1.468.
Determine the probability a student is from a family with more than 5 siblings. P(x > 5)
Determine the probability a student is from a family with more than 5 siblings. P(x > 5)
Determine the probability a student is from a family with more than 5 siblings. P(x > 5)
Determine the probability a student is from a family with more than 5 siblings. P(x > 5)
Determine the probability a student is from a family with more than 5 siblings. P(x > 5)
Determine the probability a student is from a family with more than 5 siblings. P(x > 5) = 0.0317 + 0.0124 + 0.0043 + 0.0005 + 0.0003
Determine the probability a student is from a family with more than 5 siblings. P(x > 5) = 0.0317 + 0.0124 + 0.0043 + 0.0005 + 0.0003 = 0.0492
Determine the probability a student is from a family with more than 5 siblings. P(x > 5) = 0.0492 4.92% of all college students come from families with more than 5 children (they have 4 or more brothers and sisters).
Determine the probability a student is from a family with at most 3 siblings. P(x 3) = 0.2194 + 0.2806 + 0.2329 = 0.7329
Determine the probability a student is from a family with at least 7 siblings. P(x 7) = 0.0124 + 0.0043 + 0.0005 + 0.0003 = 0.0175 Good idea: Take the reciprocal of a small probability… 1/.0175 = 57.1 1 in 57 students
Determine the probability a student is from a family with fewer than 5 siblings. P(x< 5) = 0.2194 + 0.2806 + 0.2329 + 0.1442 = 0.8771
at most 3 at least 7 less than or equal to 3 greater than or equal to 7 no more than 3 no fewer/less than 7 x 3x 7
Determine the probability a student’s number of siblings falls within 1 standard deviation of the mean. Guess? 0.68
Determine the probability a student’s number of siblings falls within 1 standard deviation of the mean. Mean= 2.743 SD = 1.468 1 SD below the mean 2.743 – 1.468 = 1.275 1 SD above the mean 2.743 + 1.468 = 4.211
Determine the probability a student’s number of siblings falls within 1 standard deviation of the mean. 1 SD below the mean = 1.275 1 SD above the mean = 4.211 Values are within 1 SD of the mean if they are between these.
Determine the probability a student’s number of siblings falls within 1 standard deviation of the mean. 1 SD below the mean = 1.275 1 SD above the mean = 4.211 Values are within 1 SD of the mean if they are between these.
Determine the probability a student’s number of siblings falls within 1 standard deviation of the mean. 1 SD below the mean = 1.275 1 SD above the mean = 4.211 Values are within 1 SD of the mean if they are between these. The probability of being between these: 0.2806 + 0.2329 + 0.1442 = 0.6577
Determine the probability a student’s number of siblings falls within 2 standard deviations of the mean. Guess? 0.95 2 SD below the mean 1.275 – 1.468 = -0.193 2 SD above the mean 4.211+ 1.468 = 5.679 Between -0.193 and 5.679.
Determine the probability a student’s number of siblings falls within 2 standard deviations of the mean. Between -0.193 and 5.679. (Equivalent to 5 or fewer.)
Determine the probability a student’s number of siblings falls within 2 standard deviations of the mean. Between -0.193 and 5.679. (Equivalent to 5 or fewer.) We know an outcome more than 5 has probability 0.0492.
Determine the probability a student’s number of siblings falls within 2 standard deviations of the mean. Between -0.193 and 5.679. (Equivalent to 5 or fewer.) We know an outcome more than 5 has probability 0.0492. The probability of an outcome at most 5 is 1 – 0.0492 = 0.9508.
Determine the probability a student’s number of siblings falls within 2 standard deviations of the mean. Between -0.193 and 5.679. 0.9508.
A company monitors pollutants downstream of discharge into a stream. Data were collected on 200 days from a point 1 mile downstream of the plant on Stream A. Data were collected on 100 days from a point 1 miles downstream of the plant on Stream B. Pollutant Particles in Streamwater
How do means compare? (What are the means?) How do SDs compare? (What are the SDs?)