Linear Relationships in Graphs and Equations
Learn about constant term, coefficient, coordinate pairs, y-intercept, points of intersection, and more in linear equations and graphs. Discover how to represent relationships through tables, graphs, and equations effectively.

Linear Relationships in Graphs and Equations
E N D
Presentation Transcript
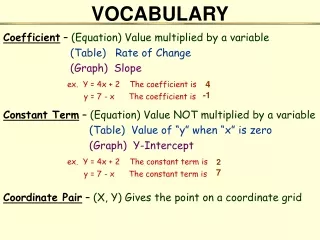
VOCABULARY 4 -1 Constant Term – (Equation) Value NOT multiplied by a variable (Table) Value of “y” when “x” is zero (Graph) Y-Intercept ex. Y = 4x + 2 The constant term is y = 7 - x The constant term is Coefficient – (Equation) Value multiplied by a variable (Table) Rate of Change (Graph) Slope ex. Y = 4x + 2 The coefficient is y = 7 - x The coefficient is 2 7 Coordinate Pair – (X, Y) Gives the point on a coordinate grid
Coordinate Pair – (X, Y) Gives the point on a coordinate grid VOCABULARY For example: (5, 3) Point of Origin – Point where x-axis and y-axis cross Point of Origin (0, 0)
Y-Intercept – (Equation) Constant term (Table) Value of “y” when “x” is zero (Graph) Point where graphed line crosses y-axis VOCABULARY Y-Intercept Point of Intersection – (Graph) Point where 2 (or more) graphed lines cross (Equation) Shared coordinate pair will solve both equations (Table) Common Data Point of Intersection
Independent Variable vs. Dependent Variable (x - axis) (y - axis) INVESTIGATION #1 Ask yourself, “Which variable depends on the other?” Labels - Title - Label Independent variable on x-axis (horizontal line) - Label Dependent variable on y-axis (vertical line) - Include “units of measure” - Include a key (if needed) - Scale: Increments need to be consistent and reasonable Tips for a Good Graph 4 Ways to Represent a Linear Relationship • Graph (Straight Line) • Table (Constant Rate of Change) • Equation (Form of y=mx+b) • 4) Story Problem / Situation (2 variables – 1 depends on the other)
INVESTIGATION #2 Table: x y Graph: Relating Tables, Graphs, and Equations - 3 - 2 - 1 0 1 2 3 - 14 - 10 - 6 - 2 2 6 10 4 Equation: y = 4x - 2 1 Coefficient: Constant Term: 4 (0, - 2) -2 Slope: Y - intercept: 4 -2 Rate of Change: Value of “y” when “x” is zero: 4 -2
INVESTIGATION #2 cont. Symbolic form of a Linear Equation Y = mx + b Relationships The greater the coefficient- Y: m: X: b: Dependent Variable -the greater the Rate of Change -the steeper the slope (equation) Coefficient If the coefficient is positive – -the “y” values in the table will increase -the slope will be positive (table) Rate of Change (graph) Slope If the coefficient is negative – -the “y” values in the table will decrease -the slope will be negative Independent Variable (equation) Constant Term (table) Value of “y” when “x” is zero If the constant term is positive – -the line will cross above the “point of origin” (graph) Y - Intercept If the constant term is negative – -the line will cross below the “point of origin”
INVESTIGATION #3 Review “Calculator Tips” & “Trouble Shooting” ( - ) vs. – key Introduction of the Graphing Calculator Xmin: Xmax: Xscl: Ymin: Ymax: Yscl: 200 -30 50 138 125 10 (10, 125) Window Settings 78 Xmin: Xmax: Xscl: Ymin: Ymax: Yscl: -5 lowest value on the x-axis -30 50 200 -5 10 highest value on the x-axis 25 Y = 4.7x + 78 number of units each tick mark represents on the x-axis Y = -1.3x + 138 lowest value on the y-axis highest value on the y-axis number of units each tick mark represents on the y-axis
INVESTIGATION #3 cont. Point of Intersection Y = 4.7x + 78 Y = -1.3x + 138 Using the Table Using the Graph • Enter both equations in the “y =“ screen • Press “2nd graph” to view the table • Scroll up or down so that “y” values are getting closer together • Search for “Common Data” where the “y” values are the same • Enter both equations in the “y =“ screen • Press “graph” to view the graph • Adjust window settings if needed to view the “Point of Intersection” • Press “2nd Trace” to Calculate • Select # 5 – “Intersect” • Press enter 4 times (until P of I is shown at the base of the screen) X Y1 Y2 Common Data (10,125) 10 125 125 Checking with the Equation Both equations should solve to be true statements when you substitute the values of the coordinate pair. Y = 4.7x + 78 125 = 4.7(10) + 78 125 = 47 + 78 125 = 125 Y = -1.3x + 138 125 = -1.3(10) + 138 125 = -13 + 138 125 = 125
INVESTIGATION #4 Parallel and Perpendicular Lines Parallel Perpendicular Parallel lines will never cross Perpendicular lines cross at 90 degree angles Equations with the same coefficient will have the same slope and will be parallel The coefficientsof the equations will be opposite reciprocals (+ / -) a/b <-> b/a Example: Example: Y = 3x + 8 Y = 3x + 8 Y = -2 + 3x Y = -2 - 1/3x 3 and –1/3 are opposite reciprocals Slope of 3 Both lines have a slope of 3 Slope of –1/3
INVESTIGATION #4 cont. SYMBOLIC METHOD • Each line must contain an equal sign (only one) • Each must contain the variable you are solving for Y = 4x - 3 Solving for “y” Solving for “x” X = 12 y = -11 Y = 4x – 3 Y = 4 (12) – 3 Y = 48 – 3 Y = 45 Y = 4x – 3 -11 = 4x – 3 Eliminate the constant term + 3 + 3 -8 = 4x Eliminate the coefficient 4 4 -2 = x
INVESTIGATION #5 SLOPE Stair Step Method Calculate Ratio Method • Select 2 points on a graphed line • Connect the points with a “stair step” • Count the number of vertical units (rise) • Count the number of horizontal units (run) • Write the SLOPE as a ratio • Select 2 coordinate pairs from a graphed line • Identify ‘pair 1’ and ‘pair 2’ • Use the Slope formula y1 – y2 x1 – x2 SLOPE = RISE RUN 2 1 SLOPE = (1,- 8) & (5,-16) x y Reminder watch for negative slopes! -16 – (-8) 5 - 1 = - 8 4 = -2 0 1 2 - 6 Rise is 3, run is 2 Negative slope 3 - 8 2 - 3 2 Slope = -10 Y = -2x - 6 (0, -2) Y = -1.5x - 2