Download
1 / 23
230 likes | 368 Vues
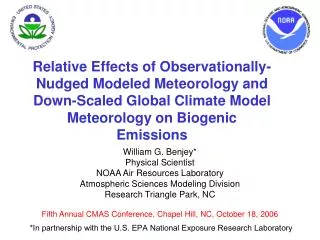
William G. Benjey* Physical Scientist NOAA Air Resources Laboratory Atmospheric Sciences Modeling Division Research Triangle Park, NC Fifth Annual CMAS Conference, Chapel Hill, NC, October 18, 2006 *.

E N D
William G. Benjey* Physical Scientist NOAA Air Resources Laboratory Atmospheric Sciences Modeling Division Research Triangle Park, NC Fifth Annual CMAS Conference, Chapel Hill, NC, October 18, 2006 * Relative Effects of Observationally- Nudged Modeled Meteorology and Down-Scaled Global Climate Model Meteorology on Biogenic Emissions *In partnership with the U.S. EPA National Exposure Research Laboratory
Outline • Climate Impact on Regional Air Quality (CIRAQ) program • Observationally nudged vs. regional climate model (RCM) meteorology • Relative effects of nudged and RCM meteorology on biogenic emissions, with the focus on three-year modeled period and summer seasons • Biogenic emissions relative to modeled meteorology patterns • Conclusions • Next steps
CIRAQ Program Objective: Assess potential climate change impacts on O3 and PM using EPA’s Community Multiscale Air Quality (CMAQ) model linked with global-scale climate and chemical transport models. • Supports theU.S. Climate Change Science Program (CCSP) research goals and synthesis products
Key CIRAQ Questions • How will future climate change and variability affect regional air quality over the United States? • What is the principle driver for future air quality (climate change and variability vs. technology-driven emissions)? • How will meteorologically-dependent mobile source and biogenic emissions respond to future climate conditions? • What are the strengths and weaknesses of using the down-scaled climate models for regional air quality assessments? What climate modeling improvements are needed?
CIRAQ Emissions • Phase 1 (by 2007): • Five year base case (~2000) • Five year future case (~2050) • Current anthropogenic emissions • Meteorologically dependent biogenic and mobile source emissions • Phase 2 (by 2010): • Add alternative future emission scenarios.
Regional Climate Model and Observationally Nudged Meteorology • Most retrospective CMAQ simulations use observationally-nudged meteorological input • CIRAQ/CMAQ uses RCM inputs without observational nudging • Question: Does lack of nudging create biases in current period emission simulations that might obscure a climate change “signal” due to “noise” in the meteorology modeling of the future?
Effects of Nudged and RCM Meteorology on Biogenic Emissions • Nudged MM5 meteorology for 2001-2003 and 5 current (base) years of RCM meteorology prepared for a U.S. modeling domain with 36km x 36km cell resolution • Hourly biogenic emission data for Isoprene and Nitric Oxide (NO) generated using the BEIS 3.13 model in the SMOKE emission model with the meteorology data • Biogenic emission data area normalized over geographic regions to aid analysis of spatial and temporal patterns • Regions include model domain, Eastern and Western U.S. and Canada, and five eastern ozone regions • Ozone regions identified using principal component analysis (Lehman et al., 2004)
Ozone Regions After Lehman et al., 2004
Effects on Biogenic Emissions (3) * * * RCM = 5 recent model years; Nudged = 2001, 2002, 2003 Area Normalized Emission Statistics by Region for RCM and Nudged Meteorology
Effects on Biogenic Emissions (4) RCM Nudged (5 recent years) (2001-2003) Mean Hourly Isoprene Emissions
Effects on Biogenic Emissions (5) Observations on Biogenic Emissions • With the exception of Region 1, mean hourly biogenic Isoprene and NO emissions based on nudged meteorology greater than when based on RCM meteorology • Percent difference larger for Isoprene than for NO • Because Isoprene emissions depend on insolation as well as temperature, they vary more than NO, which depends on temperature and precipitation
Effects on Biogenic Emissions (6) * * *RCM= 5 recent model years; Nudged=2001, 2002, 2003 Summer Season Area Normalized Emission Statistics by Region for RCM and Nudged Meteorology
Effects on Biogenic Emissions (8) Observations on Summer Emissions • Summer mean hourly biogenic emissions more variable than annual mean hourly emissions (variance) • Isoprene emissions based on nudged meteorology greater than RCM-based Isoprene emissions in all regions • Mean hourly NO emissions based on nudged meteorology greater than RCM-based emissions except Region 1 • RCM and nudged meteorology biases in general produce consistent emission biases. However, meteorological drivers (insolation, temperature, precipitation) not spatially consistent • Region 1 (Northeast) produces greatest RCM-to-nudged emission difference (+33.7%), but NO emission differences opposite sign
Meteorological Patterns • Principal component analysis reveals differences in RCM meteorology and NARR meteorology data sets based on observations. NARR similar to observationally nudged meteorology • Surface pressure, precipitation, 2 m temperature data extracted and sea level pressure calculated (1800 Z rather than all hours) • Bermuda High behavior not replicated by RCM meteorology • Summer RCM meteorology has relatively cool, dry high pressure conditions over the north and northeastern US and southern Canada during the summer
Summer Meteorological Patterns • Summer RCM temperatures 2 to 10 oK cooler over northern domain east of the Rocky Mountains • RCM underestimates precipitation for the eastern US Summer RCM-NARR temperature differences (Gilliam and Cooter, submitted)
Summer Biogenic Emission Patterns • Nudged Meteorology to RCM Meteorology-based Isoprene and NO emission differences greater in Eastern Region than Western Region – consistent with a cooler, dryer east in the meteorology analysis • Region 1 RCM-NARR summer temperature differences small overall - 1o K warmer over water near the coast and neutral to –1oK cooler inland • RCM-based Region 1 NO summer emissions very close to Nudged-based NO summer emissions – consistent with small temperature difference and no insolation dependence. RCM-based emissions slightly greater (-4.1 percent)
Summer Biogenic Emission Patterns (2) Isoprene Emissions (top – Nudged, bottom – RCM) NO Emissions (top –Nudged, bottom – RCM)
Conclusions • RCM-based biogenic emissions generally less than Nudged Meteorology-based biogenic emissions, especially for Isoprene and especially in the Northeast • Consistent with summer RCM to NARR meteorology temperature differences • Percent difference between RCM and Nudged meteorology-based biogenic emissions varies by region and by compound (Isoprene and NO). Reflects spatial differences in meteorological patterns • Initial indication that RCM-based Isoprene emissions could contribute to any tendency to under predict current period simulations of ozone concentrations in the Northeastern United States.
Next Steps • Complete detailed evaluation of the RCM to Nudged meteorology biogenic emissions for other seasons and other geographic regions • Look for sub-regional “hot spots” in the gridded emission data • Examine RCM to Nudged emission differences with respect to differences in CMAQ modeled ozone concentrations. • Apply the results to future year (~2050) biogenic emissions based on RCM meteorology • Apply results to future year CMAQ model runs and evaluate output concentrations in the context of meteorology and emission patterns
Acknowledgements Aid and comments from: • Ellen Cooter • Rob Gilliam • Steve Howard • Rohit Mathur • Donna Schwede • Jenise Swall
Disclaimer The research presented here was performed under the Memorandum of Understanding between the U.S. Environmental Protection Agency (EPA) and the U.S. Department of Commerce’s National Oceanic and Atmospheric Administration (NOAA) and under agreement number DW13921548. This work constitutes a contribution to the NOAA Air Quality Program. Although it has been reviewed by EPA and NOAA and approved for publication, it does not necessarily reflect their policies or views.