
Uploaded by
barry-palmer
16 SLIDES
285 VUES
160LIKES
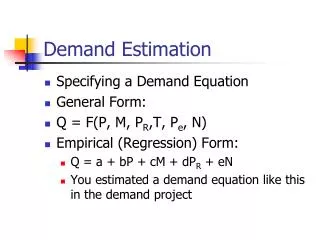
Demand Estimation Techniques and Graphical Representations
DESCRIPTION
This chapter focuses on estimation methods for demand in various contexts. It presents figures that illustrate different approaches to calculating demand, including graphical representations of demand curves, shifts, and factors influencing demand changes. The figures span across various scenarios, displaying trends and patterns that help in understanding how demand operates in different market conditions. Each figure is accompanied by explanations to enhance comprehension and application in real-world situations.
Download

1 / 16
Télécharger la présentation 
Demand Estimation Techniques and Graphical Representations
An Image/Link below is provided (as is) to download presentation
Download Policy: Content on the Website is provided to you AS IS for your information and personal use and may not be sold / licensed / shared on other websites without getting consent from its author.
Content is provided to you AS IS for your information and personal use only.
Download presentation by click this link.
While downloading, if for some reason you are not able to download a presentation, the publisher may have deleted the file from their server.
During download, if you can't get a presentation, the file might be deleted by the publisher.
E N D


More Related
Audio
Live Player