Download
1 / 15
150 likes | 327 Vues
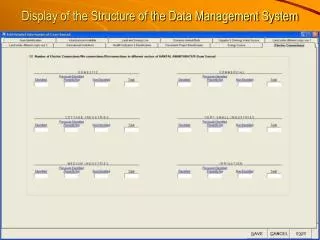
Display of the Structure of the Data Management System. Data Processing. The SIS software developed for the purpose of processing of data has been used in condensing the data into a number of heads of information at the Gram Sansad level Gram Panchayat level, and

E N D
Data Processing The SIS software developed for the purpose of processing of data has been used in condensing the data into a number of heads of information at the • Gram Sansad level • Gram Panchayat level, and • Block / Panchayat Samiti level This has helped in producing 2245 Gram Sansad wise information brochures, 157 Gram Panchayat wise booklets distributed over 14 Blocks of the district. Thus the data created along with their spatial reference, storage, retrieval and analysis in a multi-disciplinary way will help the planners at the appropriate level of planning.
Major heads of information condensed from the data Sl# Contents 1. Educational – I 2. Educational – II 3. Medical 4. P&T and Internet 5. Communication 6. Financial Institutions 7. Market / Haat 8. Office 9. Service Centre 10. Power Connection 11. Power Non-connection
Major heads of information condensed from the data Sl# Contents 12. Power Disconnection 13. Drinking Water – I 14. Drinking Water – II 15. Irrigation – I 16. Irrigation – II 17. Both Drinking Water and Irrigation – I 18. Both Drinking Water and Irrigation – II 19. Animal Husbandry 20. Educational Institutions 21. Land and Water Body Use – I 22. Land and Water Body Use – II
Major heads of information condensed from the data Sl# _ Contents ___________ 23. Mouza wise Cultivated Land (in hector) – Main Crops 24. Mouza wise Cultivated Land (in hector) – Pulses 25. Mouza wise Cultivated Land (in hector) – Oil Seeds 26. Mouza wise Cultivated Land (in hector) – Other Produce 27. Mouza wise Cultivated Land (in hector) – Vegetable 28. Mouza wise Cultivated Land (in hector) – Spices 29. Mouza wise Cultivated Land (in hector) – Cash Crops 30. Health Services 31. Beneficiaries under different Health Schemes – I 32. Beneficiaries under different Health Schemes – II 33. Non-conventional Energy Source
DESIGN OF THE OUTPUT FORMATS OF INFORMATION FOR DECENTRALISED PLANNING CATEGORY A: General Information on Variables Considered Relevant to Decentralised Planning Subject to the input variables, the system has provided easy access to unprocessed information on the variables, through simple, logically sequenced forms, thereby producing 2245 Sansad wise information brochures, 157 GP wise booklets for all the blocks in the district. (2245 no. of information brochures and 157 no. of information booklets are being sent shortly).
Category B: Summarised Information The system has produced summarised information from the general information as mentioned in A above in the form of some indicators, which would provide measures of development first separately for various areas like health, education, agriculture and finally, if possible, would provide an aggregate measure of development (encompassing various areas like health, education etc). The critical indicators would help a local body view in terms of its overall development and facilitate comparisons to identify the less developed from the relatively more developed.
List of tables of summarised information • Incidence Matrix of the different infrastructure facilities; • Distribution of Gram Sansads by distance from a given Amenity; • Distribution of Land use Pattern; • Distribution of Water Body; • Distribution of Domestic Animals and Birds; • Distribution of different sources of Drinking Water by number by Gram Panchayat; • Distribution of different sources of Water for Irrigation by number by Gram Panchayat ; • Distribution of different sources of Water both for Drinking and Irrigation by number by Gram Panchayat; • Distribution of Land under different crops by Mouza; • Distribution of Land under different Crop Combination; • Distribution of Schools by construction; • Distribution of Schools by Level of Education;
List of tables of summarised information • Distribution of Students by Gender and different Tiers; • Distribution of Students irrespective of Gender and by different Tiers; • Distribution of Teachers by level of Education/Tier; • Distribution of Beneficiaries by Block with respect to different Health Schemes under Family Planning; • Distribution of Beneficiaries by Block with respect to diseases like T.B Control, Leprosy Prevention, Malaria eradication and under Total Sanitation Programme; • Distribution of Beneficiaries by Block with respect to Mother and Child Care; • Distribution of different types of Health Care Centres (Allopathy, Homoeopathy and Ayurvedic) by Gram Panchayat; • Distribution of Non Conventional Energy sources by Block • Distribution of number of Connections of Electricity by Trade and Commerce, Agriculture and Households; • Distribution of number of Disconnections of Electricity by Trade and Commerce, Agriculture and Households; • Distribution of number of Non electrified Households and Commercial Establishments.