Download
1 / 41
410 likes | 549 Vues
Point estimates and sampling distribution. A Typical Statistics Problem. 1. Have a question in our mind. 2. ***Design a scheme to collect data (includes how many data to collect and how to collect data) 3. Collect the data 4. ***Conduct analysis. 5. ***Draw conclusions.

E N D
A Typical Statistics Problem • 1. Have a question in our mind. • 2. ***Design a scheme to collect data (includes how many data to collect and how to collect data) • 3. Collect the data • 4. ***Conduct analysis. • 5. ***Draw conclusions. • Step 2, 4 and 5 usually have a lot of probability involved.
Example I • Suppose you want to study the average GPA of students in management major. What is your plan of collecting data?
Example II • Suppose you took a simple random sample of students in management major and got the following data: • 2.1, 1.8, 2.3, 3.2, 3.6, 3.1, 2.0, 2.8, 3.2, 2.2, 2.1, 1.2, 1.6, 3.2, 3.4, 2.5, 3.5, 3.8, 2.1, 1.9. What can you say about the mean GPA of management students?
Example II • 1. The quantity we are interested in is the mean and variance of the GPA of management students. • 2. We took a simple random sample of size 20 and use the mean and variance of the GPA of this sample to estimate the average GPA of all management students.
Example II • 3. The average GPA of our sample is 2.58 and the variance is 0.56. • Formula: mean= =2.58 standard deviation= =0.56
Example II • Also, we are interested in the proportion of management students whose GPA is greater than 2.8. • 2.1, 1.8, 2.3, 3.2, 3.6, 3.1, 2.0, 2.8, 3.2, 2.2, 2.1, 1.2, 1.6, 3.2, 3.4, 2.5, 3.5, 3.8, 2.1, 1.9. • In this case, the proportion is 8 out of 20, or 0.4.
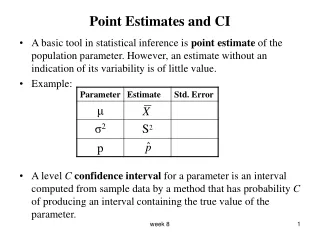
Some Concepts • We are interested in some quantities about the population, we call them population parameter. • From the sample, we get some corresponding quantities that describes the sample, we call them sample statistics. • The process of calculating sample statistics is called point estimation. • Consider a point-to-point correspondence.
Some Concepts • We call the sample quantity the point estimator of the population counterpart. • For example, • Sample mean is the point estimator of the population mean • Sample variance is the point estimator of the population variance. • Sample proportion is the point estimator of the population proportion.
Some Concepts • Given a sample, we are usually able to calculate those sample quantities. • In the previous examples, we calculated the sample mean, sample variance and sample proportion. They are 2.58, 0.56 and 0.4 correspondingly. • Those values, 2.58, 0.56 and 0.4 are the numeric values of the point estimator, they are called the point estimates.
Some Concepts • Therefore, in statistics, we usually say, find the point estimate of the population mean, variance or proportion. That means, we want to calculate the sample mean, sample variance and sample proportion.
Some Concepts • In the previous examples: • The population parameters are: population mean, population variance and population proportion. • The point estimators of those parameters are: sample mean, sample variance and sample proportion. • The point estimates of those parameters are: 2.58, 0.56 and 0.4.
Some Concepts • To be fair, we actually should say: • Sample mean is one of thepoint estimators of the population mean • Sample variance is one of thepoint estimators of the population variance. • Sample proportion is one of thepoint estimators of the population proportion. • There are many different ways to estimate a population parameter and using the sample counterpart is just one of them. • But we only talk about sample mean, variance and sample proportion in this course.
Example III • A researcher is interested in the average height of NFL players. He took a simple random sample of 100 NFL players and the sample mean is 6’5’’. • What is the population, what is the sample? • Population is all NFL players and sample is the 100 NFL players in the sample. • What is the population parameter? • The average height of all NFL players.
Example III • What is the point estimator of the population parameter? • The average height of the 100 NFL players in the sample. • What is the point estimate of the population parameter? • 6’5”
Example IV • In a clinical study on the proportion of people having diabetes in a Lafayette community, the researchers took a sample of 356 subjects, among which 56 have diabetes. • Identify population, sample, population parameter, its point estimator and point estimates.
Example IV • 1. The population will be all people living in Lafayette community. • 2. The sample will be the 356 people selected. • 3. The population parameter is the proportion of people with diabetes in Lafayette community. The point estimator of that parameter will be the sample proportion and the point estimate is 56/356
Sampling Distribution • In all examples above, we just took ONE sample and calculate the point estimates. • But we know that samples are different from each other. If we take many different samples, we will have different point estimates of the same population parameter. (That is what we call sampling variability) • How do we adjust to this discrepancy?
Sampling Distribution • Review: • Random variable: a numerical description of the outcome of an experiment. • If we consider drawing a sample from a population and calculating the point estimates of population parameter an experiment, then the outcomes of the experiment is the point estimate(s).
Sampling Distribution • Therefore, the different point estimates from different samples of the same population will be considered different numerical values of a random variable. • And random variables always have an associated probability distribution. • That probability distribution is called sampling distribution.
Sampling Distribution • Therefore, from previous examples, we know the values of sample mean, sample variance and sample proportion are all considered random variables. • Then the next question is, what is the probability distribution of those random variables?
Sampling Distribution • What we need to find answers to now? • As a random variable, we need to find its probability distribution, its mean/expected value and variance/standard deviation. • Now let’s answer these questions for the sample mean and sample proportion. • There are answers to the sample variance but it is much more complicated than the previous two and out of the range of this course.
Sampling Distribution • *** All the answers below assume we have a simple random sample. • Another thing to keep in mind is that there is a difference between taking a simple random sample from a finite or infinite population.
Sampling Distribution of Sample Mean • 1. The expected value of sample mean is the population mean. (Any point estimator that possesses this property is called an unbiased estimator). • 2. The standard deviation of sample mean depends on whether we have a finite or infinite population.
Standard deviation of sample mean • With INFINITE population. • With FINITE population: • Finite population correction factor:
Empirical Rule • When the population is infinite, • Or when the population is finite but the sample size is less than or equal to 5% of the population size, • We use:
Terminology • We usually call the population standard deviation the standard deviation. • We call the standard deviation of a point estimator, in this case the sample mean, the standard error.
Form of the sampling distribution of sample mean • Now the question is, what is the form of distribution of sample mean. • When the population from which we select a simple random sample is normally or nearly normally distributed, the sampling distribution of sample mean is normal. • When the population from which we select a SRS is NOT normally distributed, the sampling distribution can be approximated by a normal distribution for large sample size. This is by CLT.
Sampling distribution of sample mean • For a finite population of size N • For an infinite population
GPA example revisited • Using the information from our GPA example, if we know that the average GPA of Purdue students is 2.8 with a standard deviation of 1.2, what is the probability that we get a sample of size 20 with a mean between 2 or 3. • 1. Since our sample size is 20 which is far less than 5% of all Purdue students, we can use the infinite population version. • 2. P(2<x-bar<3)
GPA example revisited • =P((2-2.8)/(1.2/sqrt(20) < Z < (3-2.8)/(1.2/sqrt(20) ) • = P(-2.98 < Z < 0.75) • = Φ(0.75)- Φ(-2.98) • =0.7734-0.0014 • =0.772
Relationship between the sample size and sampling distribution of sample mean • It comes to us pretty naturally that the point estimates should be better given a larger sample size. • But how do we measure the “goodness” of an estimate? • Actually, the “goodness” of an estimate is measured by its standard deviation, or the standard error.
Relationship between the sample size and sampling distribution of sample mean • Look at the formula of standard error • We can see that the standard error decreases as n increases. • Also, the sampling distribution of sample mean is considered normal. • Compare two normal distributions with the same mean but different standard deviation, which one gives us less uncertainty?
Sampling distribution of • We know that the point estimator of the population proportion, p, is the sample proportion, , and . • Also, the expected value of sample proportion is the population proportion. • E( )=p
Sampling Distribution of • Standard deviation of , or standard error Infinite population: Finite population:
Form of the sampling distribution of • According to the central limit theorem, (or think about the normal approximation to binomial distribution), the sampling distribution of can be approximated by a normal distribution when n*p 5 and • n*(1-p) 5.
Sampling Distribution of • For a finite population of size N • For an infinite population
GPA example re-revisited • Again, using information from our GPA example, if we also know that 56% of Purdue students will have a GPA of 2.8 or higher, what is the probability that the proportion calculated from a sample of size 20 will fall below 0.3? • From CLT, we know that the sample proportion, p-bar, follows a normal distribution with mean 0.56 and variance 0.56*(1-0.56)/20
GPA example re-revisited • P(p-var < 0.3) • =P(Z<(0.3-0.56)/sqrt(0.56*0.44/20)) • = Φ (-2.34) • =0.0096
What makes a “GOOD” point estimator • Suppose we are interested in the population parameter , and we come up with an estimator . How do we decide whether is a “good” estimator of ?
What makes a “GOOD” point estimator • 1. Unbiased: • E( )= θ • 2. Efficient: each point estimator has a sampling distribution with mean and variance, the one with smaller variance is considered more efficient. • 3. Consistent: a point estimator is consistent if it becomes closer to the population parameter as the sample size increases.