Download

1 / 16
350 likes | 1.14k Vues
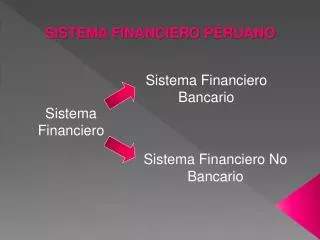
Sistema de Salud Peruano Flujo del financiamiento. Presupuesto salud. Aporte empleador. Gobierno Central. MINSA REGIONES. Seguros privados. EsSalud. EPS. SIS- AUS. Impuestos. Presupuesto histórico. Pago a proveedores. Mecanismo de pago. Primas. Prestadores MINSA Y REGIONES.

E N D
Sistema de Salud Peruano Flujo del financiamiento Presupuesto salud Aporte empleador Gobierno Central MINSA REGIONES Seguros privados EsSalud EPS SIS- AUS Impuestos Presupuesto histórico Pago a proveedores Mecanismo de pago Primas Prestadores MINSA Y REGIONES Prestadores EsSalud Prestadores MINSA Prestadores privados Gasto de bolsillo Gasto de bolsillo Servicios (beneficios) Co-pagos Población No asegurada Población SIS Población EsSalud Población activa contribuyente Promoviendo Alianzas y Estrategias. PRAES. 2006
ACCESO Y CALIDAD Quienes de benefician y cuanto • Todavía hay población que no accede a ningún servicio de salud. • El acceso es inequitativo según el lugar en donde se vive. • La calidad ha mejorado pero aún hay amplias brechas internas • Esperanza de vida al nacer (EVN) • Índice de Desarrollo Humano (IDH): http://hdr.undp.org/es/datos/explorador/
Acceso a algún Seguro de Salud INEI. Encuesta Nacional de Hogares ENAHO 2007, 2010-2012. Informe Principal. Pag. 48
Esperanza de vida al nacer, Perú 2005 - 2010 En el Perú se tiene una esperanza de vida de 71 años. Existen 11 departamentos con esperanzas de vida superiores al valor nacional. Los departamentos con mayores expectativas de vida son Lima (incluyendo Callao), Ica, Tacna, Moquegua, Arequipa.
SANITARIOS Que objetivos sanitarios se han mejorado • Desnutrición infantil • Mortalidad infantil y neonatal • Mortalidad materna, Control prenatal y parto institucional • Anemia infantil y materna • Tuberculosis , malaria, VIH y SIDA • Tasa Global de fecundidad (TGF), embarazo adolescente • Enfermedades transmisibles y no transmisibles
Desnutrición Crónica (OMS) Nacional 18,1 % INEI. Encuesta Demográfica y de Salud Familiar (ENDES). Perú 2012. http://www.inei.gob.pe/
Anemia Infantil Nacional 32,9 % Selva 37,9 % Resto Costa 27,7 % Sierra 39,8 % Lima Metropolitana 23,6 % Nota: Se refiere a niños entre 6 a 59 meses INEI. Encuesta Demográfica y de Salud Familiar (ENDES). Perú 2012. http://www.inei.gob.pe/
Mortalidad infantil MortalidadInfantilen América Latina
RAZON DE MORTALIDAD MATERNA EN EL PERU 93 2000-11 Fuente: Datos del Minsa y Endes II, III, IV
Pareto de muertes maternas notificadas según regiones. Perú 2012 Fuente: DGE-RENACE-MINSA
Tasa Global de Fecundidad Nacional 2,6 hijos por mujer Lima y Callao INEI. Encuesta Demográfica y de Salud Familiar (ENDES). Perú 2012. http://www.inei.gob.pe/
Tendencia de la Fecundidad según Área Urbana / Rural Se observa una caída de la fecundidad, de 2.9 a 2.5 nacidos vivos por mujer a nivel nacional. Asimismo se observa la brecha entre el área urbana y rural, siendo 1.6 más nacidos vivos por mujer en el área urbano que en el rural. Fuente: ENDES 2004. Informe preliminar
Fecundidad adolescente Nacional 13,2 % Lima y Callao INEI. Encuesta Demográfica y de Salud Familiar (ENDES). Perú 2012. http://www.inei.gob.pe/