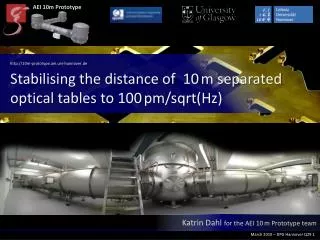
Katrin Dahl for the AEI 10 m Prototype team
410 likes | 666 Vues
AEI 10m Prototype. S uspension P latform I nterferometer for the AEI 10 m Prototype Interferometer Introductory talk. Katrin Dahl for the AEI 10 m Prototype team. September 2009 –AEI seminar. Outline. AEI 10 m Prototype Interferometer > Why is an SPI needed?

Katrin Dahl for the AEI 10 m Prototype team
E N D
Presentation Transcript
AEI 10m Prototype Suspension Platform Interferometer for the AEI 10m Prototype Interferometer Introductory talk Katrin Dahl for the AEI 10m Prototype team September 2009 –AEI seminar
Outline • AEI 10m Prototype Interferometer • > Why is an SPI needed? • Relative distance measurement experiments • Experimental setup design • Test setup • Future plans
The AEI 10m Prototype Goals: • Train peoplefor GEO600 • Provenewtechniques (PSL, digital controlsystem, Khalili cavity…) • Provideultralowdisplacementnoisetestingenvironment • To probe at (and later go beyond) the SQL • Entanglement of macroscopic test masses • For geodesy/LISA related experiments • ...
Vacuum system Tank centers separatedby11.65m Volume ca. 100 m3 22 t stainless steel Tubes: 1.5 m diameter Tanks: 3 m diameter, 3.4 m tall • 10-6mbar after about 12 hours , • 10-7mbar after about 2 weeks • ofpumping • Roughing: One 170 l/s screw pump • Main pumps: Two 2000 l/s turbo-molecularpumps • Backingand differential pumping: Two scroll pumps
Seismic Attenuation System One SAS per vacuum tank, optical table goes on top of SAS Improved version of HAM-SAS Resonance frequency around 0.1Hz Up to 80dB attenuation in both vertical and horizontal directions Angstrom residual motion above 1Hz
Why a Suspension Platform Interferometer? • Ease lock acquisition of cavities by reducing residual test mass motion • Reduction of burden to actuators on the mirrors • Testbed for GRACE follow-on and LISA related experiments Sets requirements on SPI
A little bit of history LIGO-T870001-00-R
Suspension Point Interferometer • monitors differential motion of the suspension points of input and end test masses LIGO-T070209-00-Z
Suspension Point Interferometer LIGO-T070209-00-Z
Digital Interferometry Advantages: • no specific lock point • continuous sensing • track the position of • mirrors over many µm LIGO-T080139-00-I
Stabilised metrology testbed around 1m K Numata, J Camp, Proc. of SPIE Vol. 6265
Stabilised metrology testbed Control bandwidth 10 Hz Yaw angle motion of 20nrad/sqrt(Hz) at 10mHz leading to about 50 times worse result for only one controlled degree of freedom K Numata, J Camp, Proc. of SPIE Vol. 6265
THE AEI SPI • Requirements: • No specific lock point • Control bandwidth 100 Hz • 100pm/sqrt(Hz) and 10nrad/sqrt(Hz) @ 10mHz • Heterodyne Mach-Zehnderinterferometry • Suits our needs best • In-house knowledge ....Thanks LTP/LISA folks!
Measurement bench • Beam height 45mm • Overall height below 65mm
Phase determination Phase isextractedfromheterodynesignalbyuse of an hardwarePhasemeterbased on FPGA chips • Preamplifierand A/D conversion • Photocurrentconvertedtovoltage • Digitisingsignals • results in time series • Single bin discrete Fourier transform • Fourier transformatonlyonefrequency • complexamplitudeof PD signalatfhet • Signal combinationofeach QPD quadrantleadstophase, DC, Differential WavefrontSensing (DWS) andcontrastinformation Illustration of DWS
Choice of parameters • Due to the arm length mismatch (20m optical path length) a highly stabilised laser is necessary: • 280Hz/sqrt(Hz) @ 10mHz for green light (532nm) or • 140Hz/sqrt(Hz) @ 10mHz for IR light (1064nm) • decision made for 1064nm
Iodine stabilised Nd:YAG laser output power: 1W Stabilisation via Modulation Transfer Spectroscopy Michael Tröbs
Choice of parameters • According to the arm length mismatch (20m optical path length) a highly stabilised laser is necessary: • 280Hz/sqrt(Hz) @ 10mHz for green light (532nm) or • 140Hz/sqrt(Hz) @ 10mHz for IR light (1064nm) • decision made for 1064nm • Control bandwidth 100Hz heterodyne frequency around 20kHz new phasemeter interface needed
Choice of parameters • According to the arm length mismatch (20m optical path length) a highly stabilised laser is necessary: • 280Hz/sqrt(Hz) @ 10mHz for green light (532nm) or • 140Hz/sqrt(Hz) @ 10mHz for IR light (1064nm) • decision made for 1064nm • Control bandwidth 100Hz heterodyne frequency around 20kHz • Thermal driftsrequirescomponentstobemonolithicallybondedtoplatewithlow CTE (ClearCeram, CTE=0.4*10-7/K)
UV curing epoxy • Advantage: almost infinite alignment time • Optocast 3553-LV-UTF • CTE = 55PPM/°C, viscosity @ 25°C = 500cps • cps = centipoise, water = 1cps, castrol oil = 1,000cps, honey = 10,000cps, ketchup = 50,000cps • Disadvantage: layer thickness is not reproducible, e.g. 10µm, 98µm, 79µm, 70µm, 37µm misalignment in pitch • stick to hydroxide-catalysis bonding technique
Expected transversal signals Phase difference [rad] contrast -2 -1 0 1 2 -2 -1 0 1 2 Transveral displacement of MW1 or MS1 [mm] Transveral displacement of MW1 or MS1 [mm] DC DWS [rad] Red curve: PDCW1 Black curve: PDCS1 -2 -1 0 1 2 -2 -1 0 1 2 Transveral displacement of MW1 or MS1 [mm] Transveral displacement of MW1 or MS1 [mm]
Expected longitudinal signals contrast Phase difference [rad] -2 -1 0 1 2 -2 -1 0 1 2 Longitudinal displacement of MW1 or MS1 [mm] Longitudinal displacement of MW1 or MS1 [mm] DWS [rad] DC Red curve: PDCW1 Black curve: PDCS1 -2 -1 0 1 2 -2 -1 0 1 2 Longitudinal displacement of MW1 or MS1 [mm] Longitudinal displacement of MW1 or MS1 [mm]
Expected rotational signals Phase difference [rad] contrast -10 -5 0 5 10 -10 -5 0 5 10 Rotation of MW1 or MS1 [mdeg] Rotation of MW1 or MS1 [mdeg] DWS [rad] DC Red curve: PDCW1 Black curve: PDCS1 -10 -5 0 5 10 -10 -5 0 5 10 Rotation of MW1 or MS1 [mdeg] Rotation of MW1 or MS1 [mdeg]
Test setup • Use of vacuum • compatible • components • (free of grease)
Next steps • Stabilisation loops • Amplitude stabilisation @ 20kHz • Optical pathlenght difference stabilisation • Bond optics • Build calibrated QPD • Use CDS via phasemeter interface • Install final setup inside vacuum envelope • Calibrate signals • Table actuation • Reach design sensitivity