Download

1 / 34
340 likes | 356 Vues
Detailed summary of the 2003 Atlantic Hurricane Season, including statistics, main development regions, storm tracks, and historical perspective, with a focus on the Accumulated Cyclone Energy (ACE) Index. Analysis of forecast outlooks and climate factors influencing hurricane activity.

E N D
2003 Atlantic Hurricane Season Summary By Gerald Bell, Muthuvel Chelliah Climate Prediction Center NOAA/ NWS And NOAA Atlantic Hurricane forecast team members Dr. Chris Landsea1, Stanley Goldenberg1, Dr. Richard Pasch2, Eric Blake2 1 Hurricane Research Division/ NOAA/ OAR 2 National Hurricane Center/ NOAA/ NWS
Outline • Season statistics • Total seasonal activity • Rainfall from U.S. landfalling tropical systems • Atmospheric circulation • Ongoing active decadal signal • NOAA Atlantic Hurricane Outlooks • Summary
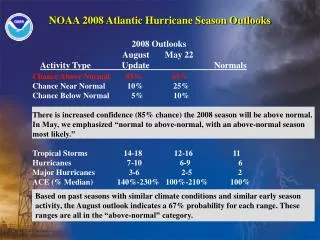
2003 Atlantic Hurricane Season Statistics Observed Above Normal 14 Tropical Storms 6 Hurricanes 3 Major Hurricanes 180.5 % ACE Index (% median) Observed NOAA Prediction Season Type May 23 August 7 Above Normal Above Normal 55% 60% Near Normal 35% 35% Below Normal 10 % 5% 14 Tropical Storms 11-15 12-15 6 Hurricanes 6-9 7-9 3 Major Hurricanes 2-4 3-4 183 % ACE Index (% median) 110-180% 120-170%
Main Development Region Main Development Region (MDR) MDR is defined as tropical Atlantic and Caribbean Sea between 9o-21.5oN During 1949-2002 Tropical Systems first named in MDR account for: 71% of the 53-year total activity measured by ACE index 55% of all hurricanes 79% of all major hurricanes Nine-fold drop in activity in MDR between above- and below-normal seasons
2003 Named Storm Tracks Main Development Region Figure Courtesy of Unisys.com
All Main Development Region Extratropics Gulf of Mexico 2003 Atlantic Tropical Systems By Region Where First Named Tropical Hurricanes Major Storms Hurricanes
Total Seasonal Activity • Total seasonal activity: Collective strength and duration of tropical storms and hurricanes • More representative of overall activity than seasonal numbers systems • NOAA’s Accumulated Cyclone Energy (ACE) Index: • Wind energy index defined as sum of squares of 6-hourly maximum sustained wind speed for all systems while at least tropical storm strength. Similar to HDP index ( Gray et al., CSU). • ACE is highly predictable and dominated by activity in MDR • Key forecast parameter for NOAA hurricane outlooks • Used to classify seasons: above normal, near normal, below normal
Atlantic Basin Main Development Region Historical Perspective: ACE Index Above Normal Season 103 Near Normal 65 Below Normal Season 2003 Predicted Range 2003 Active Decade ACE = 134 13 TS, 8 h, 3.6 MH IN-active Decades ACE = 65 9 TS, 5 H, 1.5 MH Active Decades ACE = 114 10 TS, 6.5 H, 3 MH
Main Development Region Extratropics Gulf of Mexico 2003 ACE Index by Storm
U.S. Rainfall TotalsLandfalling Tropical Systems 6 named storms made landfall in U.S. during 2003 4 formed over Gulf of Mexico 2 formed in MDR 1 hit as tropical depression (Henri) 3 hit as tropical storms (Bill, Grace, Erika) 2 hit as hurricanes (Claudette, Isabel)
Storm Precipitation Totals (mm) Hurricane Claudette (MDR) 15-16 July TS Bill (G. Mexico) 30 Jun - 1 Jul
Storm Precipitation Totals (mm) TS Erika (G. Mexico) 16-17 August TS Grace (G. Mexico) 31 August
Storm Precipitation Totals (mm) Hurricane Isabel (MDR) 18-19 Sep TS Henri (G. Mexico) 6 Sep
Precipitation (mm): 30 Jun – 9 Oct Percent of Period Total Precip by landfall days Total Precipitation during landfall days
Height and Anomalies (shading)August-September 200-hPa Stronger Subtropical Ridge 1000-hPa Lower Surface Pressure
200-850 hPa Anomalous Vertical Wind Shear August-September 2003 Anomalous Shear of Zonal Wind Anomalous Easterly Shear, Stronger Tropical Easterly Jet Anomalous Strength of Vertical Shear Lower Shear
Anomaly 700-hPa Rel. Vort. (shading), Zonal Wind (contour) Aug-Sep 2003 Mean African Easterly Jet axis north of normal Cyclonic Shear (shading) Cyclonic Anoms (Red) Westerly Anoms
200-850 hPa Anomalous Vertical Shear of Zonal Wind: Aug-Sep. Higher Shear M/S -8 –6 –4 -2 0 2 4 Lower Shear 1980 1985 1990 1995 2000 Averaging Region
700-hPa Zonal Wind Anomalies Aug-Sep M/S –2 –1 0 1 2 3 4 1980 1985 1990 1995 2000 Averaging Region
Anomalous 700-hPa Relative Vorticity:Equatorward flank of African Easterly Jet Aug-Sep Cyclonic x 10-6 S-1 -4 –2 0 2 4 6 8 Anticyclonic 1980 1985 1990 1995 2000 Averaging Region
Climate Links to Tropics • Tropical convection is dominant forcing of coherent circulation anomalies associated with seasonal and decadal extremes in Atlantic hurricane activity. (Bell and Chelliah 2004) • Dominant Climate factors: • ENSO (Gray (1984): • Tropical multi-decadal mode (TMM): Chelliah and Bell (2003)
NOAA’s Atlantic Hurricane Outlooks Forecast Procedure • Predict ASO state of the two leading tropical modes. • Use EOF regressions and analogue/ binning techniques to • predict upcoming atmospheric conditions and activity in MDR • Analysis of the combined modes is critical to the forecast • 2. Observed Apr-May, Jun-Jul anomalies to predict ASO activity • Analogue years, bin with respect to leading tropical modes. • Extended CCA forecasts of vertical shear • Final outlook is subjective blend of items 1-2
NOAA Seasonal Atlantic Hurricane Outlook August Forecast vs. Observed: 1998-2003 Hurricanes Tropical Storms 10 15 14 9 14 14 8 8 12 12 6 4 ACE Index Major Hurricanes 240 206 5 183 4 3 135 3 122 3 2 76 Observed Forecast Range Green bars indicate climatological mean and ACE range for near-normal season (76%-120% of Median)
Summary • Above-normal 2003 Atlantic hurricane season. • 1995-2003 most active in record • 2. Most of 2003 activity (86% of ACE index) associated with MDR. • 3. Ongoing decadal atmospheric signal favors active hurricane seasons. • 4. NOAA outlooks based on prediction of ENSO and Tropical Multi-decadal Mode • 5. Diagnosing and forecasting seasonal Atlantic hurricane variability requires an understanding of both modes, and their combined impacts.
Much activity in MDR 850-mb Westerlies (Weaker Easterly Trades) 2003 Above-normal Hurricane Season Conditions Amplified Subtropical Ridge Stronger Tropical Easterly Jet (200-hPa) Enhanced Tropical Easterly Jet (200-mb) WET Favorable African Easterly Jet (700-hPa) Very Low Vertical Shear • Favorable African Easterly Jet (700-hPa) reflects • Northward shift of jet axis • Strong cyclonic shear along southern flank
700-hPa Rel. Vort., Zonal Wind (contour) April-May 2003 Anomalies Cyclonic Westerly June-July 2003 Anomalies
700-hPa Potential VorticityAugust-September Mean 2003 High PV in MDR, Gradient Reversal Linear Instability 1997 (Inactive Season) Lower PV in MDR, No Gradient Reversal
Precipitable Water (inches), 1000-hPa WindAugust-September 2003 High Precipitable water in MDR and West African monsoon region