Download
1 / 2
20 likes | 341 Vues
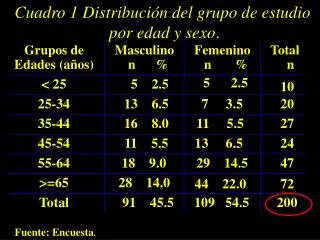
Cuadro 1 Distribución del grupo de estudio por edad y sexo. Grupos de. Masculino. Femenino. Total. Edades (años). n %. n %. n. 5 2.5. < 25. 5 2.5. 10. 25-34. 13 6.5. 7 3.5. 20. 35-44. 16 8.0. 11 5.5. 27. 45-54. 11 5.5. 13 6.5.

E N D
Cuadro 1 Distribución del grupo de estudio por edad y sexo. Grupos de Masculino Femenino Total Edades (años) n % n % n 5 2.5 < 25 5 2.5 10 25-34 13 6.5 7 3.5 20 35-44 16 8.0 11 5.5 27 45-54 11 5.5 13 6.5 24 55-64 18 9.0 29 14.5 47 >=65 28 14.0 44 22.0 72 Total 91 45.5 109 54.5 200 Fuente: Encuesta.
Cuadro 2 Tiempo de evolución de la HTA y enfermedades asociadas A.V.E n % RET C.I n % Renal n % Total n % Años n n % < 8 109 7 6,4 3 2,7 11 10,1 1 0,9 22 20,2 17,5 8 y más 45 49,4 7 7,7 16 91 17 18,5 5 5,5 total 200 27 67 33,5 14 20 20 10,0 7,0 6 3,0 13,5 Chi 2 0,947 9,90 1,34 2,03 8,65 p 0,50 0,001 0,247 0,154 0,003 p <0,05 Fuente: Encuesta.