Break-even Example 1
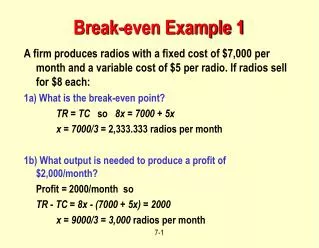
Break-even Example 1. A firm produces radios with a fixed cost of $7,000 per month and a variable cost of $5 per radio. If radios sell for $8 each: 1a) What is the break-even point? TR = TC so 8x = 7000 + 5x x = 7000/3 = 2,333.333 radios per month

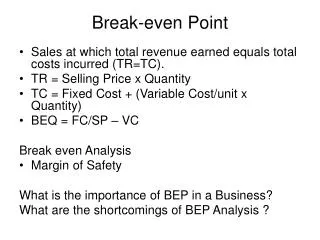
Break-even Example 1
E N D
Presentation Transcript
Break-even Example 1 A firm produces radios with a fixed cost of $7,000 per month and a variable cost of $5 per radio. If radios sell for $8 each: 1a) What is the break-even point? TR = TC so 8x = 7000 + 5x x = 7000/3 = 2,333.333 radios per month 1b) What output is needed to produce a profit of $2,000/month? Profit = 2000/month so TR - TC = 8x- (7000 + 5x) = 2000 x = 9000/3 = 3,000 radios per month
Break-even Example 1 - continued 1c) What is the profit or loss if 500 radios are produced each week? First, get monthly production: 50052/12 = 2,166.6667 radios per month Then calculate profit or loss TR - TC = 82166.6667 - (7000 + 52166.6667) = $-500 per month ($500 loss per month)
Break-even Example 2 A firm produces radios with a fixed cost of $7,000 per month and a variable cost of $5 per radio for the first 3,000 radios produced per month. For all radios produced each month after the first 3,000 the variable cost is $10 per radio (for added overtime and maintenance costs). If radios sell for $8 each: 2a) What are the break-even point(s)? Now TC has two parts depending on the level of production: For x 3000/month:TC = 7000 + 5x For x > 3000/month: TC = 7000 + 5(3000) + 10(x-3000) = -8000 + 10x For any x: TR = 8x
Break-even Example 2 - continued For x 3000/month:TC = 7000 + 5x For x > 3000/month: TC = -8000 + 10x For any x: TR = 8x For x 3000/month:7000 + 5x = 8x so x = 2,333.33/month This is < 3000/month, so it is a valid break-even point. For x> 3000/month:-8000 + 10x = 8x so x = 4000/month This is > 3000/month, so it is also a valid break-even point.
Break-even Example 2 40 Dollars (Thousands) Total revenue line 32 24 Total cost line 16 Break-even points 8 1000 2000 3000 4000 Volume (units/month)
Break-even Example 3 A firm produces radios with a fixed cost of $7,000 per month and a variable cost of $5 per radio for the first 2,000 radios produced per month. For all radios produced each month after the first 2,000 the variable cost is $10 per radio (for added overtime and maintenance costs). If radios sell for $8 each: 3a) What are the break-even point(s)? Again TC has two parts depending on the level of production: For x2000/month:TC = 7000 + 5x For x > 2000/month: TC = 7000 + 5(2000) + 10(x-2000) = -3000 + 10x For any x: TR = 8x
Break-even Example 3 - continued For x2000/month:TC = 7000 + 5x For x > 2000/month: TC = -3000 + 10x For any x: TR = 8x For x2000/month:7000 + 5x = 8x so x = 2,333.33/month This is not < 2000/month, so it is not a break-even point!! For x> 2000/month:-3000 + 10x = 8x so x = 1500/month This is not > 2000/month, so it is not a break-even point!! THERE ARE NO BREAK-EVEN POINTS!
Break-even Example 3 40 Dollars (Thousands) 32 24 Total cost line Total revenue line 16 8 1000 2000 3000 4000 Volume (units/month)
Other Break-even Possibilities 40 Dollars (Thousands) 32 24 Total cost line Total revenue line 16 8 1000 2000 3000 4000 Volume (units/month)
Crossover Chart Process A: Low volume, high variety Process B: Repetitive Process C: High volume, low variety Total cost - Process A Total cost - Process B Total cost - Process C Process B Process A Process C Lowest cost process
Crossover Example Process A: FA = $5000/week VA = $10/unit Process B: FB = $8000/week VB = $4/unit Process C: FC = $10000/week VC = $3/unit Over which range of output is each process best? 1. At x = 0 A is best (FA is smallest fixed cost). 2. As x gets larger, either B or C may become better than A: B < A for x > 3000/6 or x > 500/week C < A for x > 5000/7 or x > 714.28/week so B is best for x > 500/week 3. Eventually, C will become better than B (VC< VB). C < B for x > 2000/week
0 2000 500 714 A<B A<C B<C A<B A<C B<C A<B<C B<A A<C B<C B<A<C B<A C<A B<C B<C<A B<A C<A C<B C<B<A Crossover Example Summary: A is best for output of 0-500 units per week. B is best for output of 500-2000 units per week. C is best for output greater than 2000 units per week.
Process A: low volume, high variety Process B: Repetitive Process C: High volume, low variety Total cost - Process A Total cost - Process B Total cost - Process C Fixed cost - Process C Fixed cost - Process B Fixed cost - Process A Lowest cost process Process A Process B Process C Crossover Chart
Variable cost Variable cost Variable cost $ $ $ Fixed cost Fixed cost Fixed cost Low volume, high variety process Repetitive process High volume, low variety process Total cost for low volume high variety Total cost for repetitive process B1 Total cost for high volume, low variety process B2 B3 B A Volume Cost of Wrong Process Found Via Breakeven Analysis
Time Value of Money - Net Present Value • Future cash receipt of amount F is worth less than F today. F = Future value N years in the future. P = Present value today. i = Interest rate.
Annuities • An annuityis a annual series of equal payments. R = Amount received every year for N years. S = Present value today. S = RX where X is from Table 7.5 (page 264). Example: What is present value of $1,000,000 paid in 20 equal annual installments? For i=6%/year, S = 5000011.47 = $573,500 For i=14%/year, S = 500006.623 = $331,150
Limitations of Net Present Value • Investments with the same NPV will differ: • Different lengths. • Different salvage values. • Different cash flows. • Assumes we know future interest rates! • Assumes payments are always made at the end of the period.
Limitations of Net Present Value • Investments with the same present value may have significantly different project lives and different salvage values • Investments with the same net present values may have different cash flows • We assume that we know future interest rates - which we do not • We assume that payments are always made at the end of the period - which is not always the case