Break Even
Break Even. Lesson 3. Lesson Objectives. £ To construct break-even charts ££ To evaluate how changes impact the break-even chart £££ To analyse the strengths and weaknesses of break-even analysis. Break-even charts Eat-your-fill restaurant.

Break Even
E N D
Presentation Transcript
Break Even Lesson 3
Lesson Objectives £ To construct break-even charts ££ To evaluatehow changes impact the break-even chart £££ To analyse the strengths and weaknesses of break-even analysis
Break-even chartsEat-your-fill restaurant Construct a break-even chart using the information in the table You will each need a piece of graph paper, a ruler and a pencil You have 5 minutes to complete this … ON YOUR OWN
Bill Potter Using the information in the table construct a break-even chart. If you need help, refer to the chart that you constructed last lesson
The break-even chart was included in Bill’s business plan, however the Bank Manager questioned the high selling price. Bill completed some market research and decided that £85 would be more realistic. • He also decided that it would be best to rent a shop in a better location but this would cost an extra £20,000 a year. • Compare the two break-even charts
Strengths and weaknesses of break even analysis • Working in a pair, list as many strengths and weaknesses as possible • Weaknesses • Assumes that all output is sold • Assumes that the business only sells one product • Assumes that everything is consistent • It does not show what will happen, revenue or price may change • Strengths • Simple concept • Good for decision making • Used when applying for loans • Can be easily changes to deal with ‘what if’ situations
Complete the following • Research topic: Use the BBC Business website to research a company that is struggling to meet its break-even point. • Hint: Search for the Airbus A380
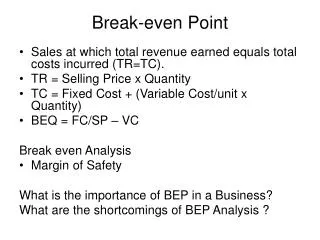
Plenary • Can you… • Explain what contribution and contribution per unit mean • Explain what ‘breaking-even’ means and define break-even point • Use contribution per unit to calculate the break-even point • Draw a break-even chart and identify its main features • Change any of the key variables- price, variable cost and fixed cost- and re-draw a break-even chart • Use the data to advise decision making • Evaluate the usefulness of break-even analysis