Download
1 / 33
330 likes | 360 Vues
Achieve soundness in workflow graphs by decomposing into SESE fragments, enabling fast analysis and error debugging for business processes. Our preprocessor enhances soundness checkers, bringing a trade-off between speed and debugging information to improve workflow model efficiency.

E N D
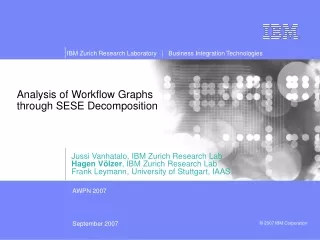
Analysis of Workflow Graphs through SESE Decomposition Jussi Vanhatalo, IBM Zurich Research Lab Hagen Völzer, IBM Zurich Research Lab Frank Leymann, University of Stuttgart, IAAS
Control-flow errors in business process models • Business process models are no longer only for documentation • Increasing importance when models are executed • Workflow engine • Realistic business measures through simulation • Code generation • Our experience [Koehler, Vanhatalo, 2007] & other studies [Mendling et al., 2006] • Control-flow errors, e.g. deadlocks occur frequently in real models • Early detection can substantially save costs
Workflow graph = Free-Choice workflow net Sound workflow graph = no control-flow errors Known soundness checkers can: Check soundness in cubic time Produce error trace in exponential time Our contribution is a preprocessor: Speeds up any soundness checker Improves debugging information Trade off – Speed versus debugging information Workflow graph Workflow graph Preprocessor Soundness checker Sound? Yes / No Debugging information
Our preprocessor has two parts: Decomposition of workflow graph Into fragments that can be checked in isolation Decomposition takes linear time Fast heuristics Sort out many fragments occuring in practice Takes linear time Our contribution Workflow graph Decomposition Fast heuristics Sound ? Unsound Soundness checker Sound? Yes / No Debugging information
Outline • Introduction • Workflow graphs • Soundness • Decomposition into fragments • Heuristics for analyzing soundness • Case study • Conclusion
Workflow graph activity fork join a1 stop node a2 start node merge a3 decision
Terminal state never becomes dead = (1)+(2): No (local) deadlock A join cannot get enough tokens No lack of synchronization An edge carries two or more tokens at the same time Soundness of a workflow graph Initial state Terminal state a1 a2 a3 exit edge entry edge Deadlock a1 a3 a2 Lack of synchronization a1 a3 a2
Outline • Introduction • Decomposition into fragments • Fragments • Decomposition • Process structure tree • Heuristics for analyzing soundness • Case study • Conclusion
Single-entry-single-exit (SESE) fragments • A SESE fragment is a connected subgraph that has a single entry edge and a single exit edge. fragment entry edge exit edge C a1 f1 j1 a4 a8 f2 j2 j3 a2 d1 m1 a6 a9 f7 f3 j6 a3 a5 a7 a14 a10 f5 m4 f4 j4 a16 j5 a11 d4 d2 f6 m3 d3 a13 m5 a17 m2 a12 a15
j3 f2 f7 j6 j1 j2 f1 f3 j4 f6 f5 f4 j5 m4 m1 m5 m3 m2 Single-entry-single-exit (SESE) fragments • SESE fragments are either nested (e.g. J and C), or disjoint (J and V) • SESE fragments do notoverlap (essentially) J C a1 a4 a8 a2 d1 a6 a9 a3 a5 a7 V a14 a10 a16 a11 d4 d2 d3 a13 a17 a12 a15
j3 f2 f7 j6 f5 j1 f1 f6 j4 f4 f3 j2 j5 m2 m4 m1 m5 m3 Decomposition into fragments • There is a unique decomposition into SESE fragments • Linear-time algorithm for SESE decomposition known from compiler theory used for discovering thestructure of sequential programs [Johnson et al., 1994] Z X J K C A I a1 E a4 a8 B G L a2 d1 a6 a9 D F H a3 a5 a7 Y V W O R M a14 T a10 a16 N a11 d4 d2 Q d3 a13 U P a17 a12 S a15
f2 j3 f7 j6 f1 f6 j2 f5 j4 f4 f3 j1 j5 m3 m2 m1 m4 m5 Process structure tree Z Y X K J L V W C D E F G H I R S T U O P Q B A M N Z X J K C A I a1 E a4 a8 B G L a2 d1 a6 a9 D F H a3 a5 a7 Y V W O R M a14 T a10 a16 N a11 d4 d2 Q d3 a13 U P a17 a12 S a15
f4 j4 f4 j4 m3 m3 m2 m2 Each fragment can be analyzed in isolation • A fragment is sound if and only if • all its child fragments are sound, and • the fragment that is obtained by replacing each child fragment with an activity is sound. [Valette, 1979] O a10 P Q a12 a13 a11 Sound Sound V O Sound a10 + a11 V d2 O Q d3 a13 P a12 d2 Sound d3 Q P Sound
f4 j4 m3 m2 m2 m3 View switch • “Fragment” means the second view in the following V V O O a10 a11 d2 d2 Q d3 d3 Q a13 P P a12
f2 j3 f7 j6 f1 f6 j2 f5 j4 f4 f3 j1 j5 m3 m2 m1 m4 m5 Bottom-up analysis Z Y X K J L V W C D E F G H I R S T U O P Q B A M N Z X J K C A I a1 E a4 a8 B G L a2 d1 a6 a9 D F H a3 a5 a7 Y V W O R M a14 T a10 a16 N a11 d4 d2 Q d3 a13 U P a17 a12 S a15
j3 f2 f7 j6 f1 f6 j2 f5 j4 f4 f3 j1 j5 m2 m1 m4 m5 m3 Locating an error Z Y X K J L V W C D E F G H I R S T U O P Q B A M N Z X J K C A I a1 E a4 a8 B G L a2 d1 a6 a9 D F H a3 a5 a7 Y V W O R M a14 T a10 a16 N a11 d4 d2 Q d3 a13 U P a17 a12 S a15
Number of fragments is linear in graph size Time complexity of the soundness checker is cubic (exponential for error trace) The size of the largest fragment is the most important factor for worst-case running time Reduction achieved through decomposition Workflow graph 20 Decomposition Largest 8 4 6 2 Soundness checker Sound? Yes / No 8000 vs. 800 Debugging information 1 048 576 vs. 340
Outline • Introduction • Decomposition into fragments • Heuristics for analyzing soundness • Heuristic for sound fragments • Heuristic for unsound fragments • Case Study • Conclusion
Heuristic for sound fragments – Well-structured fragments Well-structured sequence Well-structured alternative branching • All sound, and all recognized in linear time G E D B C A F Well-structured cycle Well-structured concurrent branching O L M K N
No forks, no joins No concurrency No decisions, no merges Nocycles f2 j3 j2 f3 m2 m3 Heuristic for sound fragments – Pure fragments Pure alternative branching (State machine) Pure concurrent branching (Marked graph) V K O E I G d2 d3 Q F H P • All sound, and all recognized in linear time
f6 f5 j5 m4 m5 Complex fragments • Not well-structured, nor pure Mixes of forks/joins with decisions/merges • Sound or unsound Soundness checker required Sound complex fragment Unsound complex fragment W R T C Deadlock A d4 B U S
Outline • Introduction • Decomposition into fragments • Heuristics for analyzing soundness • Heuristic for sound fragments • Heuristic for unsound fragments • Case study • Conclusion
Heuristic for unsound fragments D Deadlock H Lack of synchr. A E B F C G At least one join, but no forks At least one fork, but no joins L P Deadlock Lack of synchr. I M J N K O At least one merge, but no decisions At least one decision, but no merges • All unsound, and all recognized in linear time
Heuristic for unsound fragments – Cyclic Fragments H Deadlock H Lack of synchr. G G A cycle, but no merges A cycle, but no decisions H Deadlock G A cycle, but no merges and no decisions • All unsound, and all recognized in linear time
Outline • Introduction • Decomposition into fragments • Heuristics for analyzing soundness • Case study • Reductions achieved with the decomposition • Applicability of the heuristics • Conclusion
More than 340 process models: Industrial business process models Modeled with the IBM WebSphere Business Modeler Library 1: More than 140 process models Library 2: More than 200 process models Experimental extension of Library 1 Average analysis time per workflow graph is less than 0.1 seconds Excluding the soundness checker Case study Workflow graph Decomposition Fast heuristics Sound ? Unsound Soundness checker Sound? Yes / No Debugging information
Library 1 Reduction factor = Graph size / size of largest fragment Average 2.8 (min: 1.0, max: 9.0) Reductions achieved with the decomposition 140 x Workflow graph Average size: 67 edges (min: 11, max: 215) Decomposition Largest Average size of the largest fragment: 24 edges (min: 11, max: 51) Fast heuristics ? Sound Unsound Soundness checker Sound? Yes / No Debugging information
Reduction increases as the graph size increases • Upper boundary for the largest fragment size seems to be independent of graph size
Library 1 Applicability of the heuristics 140 x Workflow graph Decomposition Largest Fast heuristics ? Sound 100 % 0 % Unsound 0 % Soundness checker Sound? Yes / No All sound Debugging information
Library 2 Applicability of the heuristics 200 x Workflow graph Decomposition Largest Fast heuristics ? Sound 80.3 % 14.3 % Unsound 5.4 % Soundness checker Sound? Yes / ? / No Debugging information
Outline • Introduction • Decomposition into fragments • Heuristics for analyzing soundness • Case study • Conclusion
Our preprocessor has two parts: Decomposition of workflow graph Divide-and-conquer technique Linear time algorithm Fast heuristics Resolves many fragments occurring in practice Linear time algorithm Conclusion Workflow graph Decomposition Fast heuristics Sound ? Unsound Soundness checker Sound? Yes / No Debugging information
Future work • Integrate our prototype to a soundness checker • Compare the analysis times • Use cases for the SESE decomposition: • Browsing and constructing large processes • Discovery of reusable subprocesses • Code generation