Download
1 / 25
250 likes | 405 Vues
James Bonaiuto (work with Michael Arbib, USC) Andersen Laboratory California Institute of Technology. Synthetic Brain Imaging: A Computational Interface Between Electrophysiology and Neuroimaging. The Challenge of Data Integration and Interpretation.

E N D
James Bonaiuto (work with Michael Arbib, USC) Andersen Laboratory California Institute of Technology Synthetic Brain Imaging: A Computational Interface Between Electrophysiology and Neuroimaging
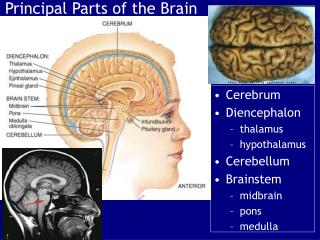
The Challenge of Data Integration and Interpretation • Two of the major problems facing cognitive neuroscientists are data interpretation and comparison across modalities • Neuroimaging studies are typically designed to test some conceptual model of the interactions between the brain regions involved in a task. • The results are usually evaluated using an ad-hoc verbal analysis and compared to neurophysiological data. ? ≈ Buccino et al (2004) Rizzolatti et al (1995)
From Neural Activity to BOLD Response Neural activity Signalling Vascular response BOLD signal Vascular tone (reactivity) Autoregulation Blood flow, oxygenation and volume Synaptic signalling arteriole B0 field glia Metabolic signalling venule (figure by Richard Wise) BOLD signal ≠ Neuron firing
Synthetic Brain Imaging • Synthetic Brain Imaging was developed to address the disconnect between experimental modalities • Computational models based on neurophysiological data are used to generate simulated neuroimaging signals: • regional cerebral blood flow (rCBF) • blood oxygen level-dependent (BOLD) responses • This technique has been used to successfully predict: • A projection from the PFC to the anterior intraparietal region AIP (Arbib, Fagg & Grafton, 2002) • Populations of sound contour-selective cells in secondary auditory cortex (Husain et al., 2004)
What is the Appropriate Neural Model? • It depends on the data the model is intended to address • Early synthetic brain imaging approaches used firing rate models (Arbib et al., 1995; Horwitz et al,. 1998) • We require the simplest possible model that can produce a wide range of firing patterns (Izhikevich, 2004)
Neurophysiology and fMRI (Lauritzen et al., 2003) (Goense & Logothetis, 2008) • Under some conditions spiking activity and CBF dissociate • In general, local field potential (LFP) is a better predictor of BOLD than spiking activity • LFP most directly reflects synaptic rather than spiking activity • We therefore require a model with realistic synaptic activity
Neurovascular Coupling • We use the sum of synaptic conductances as the measure of neural activity • Several mechanisms coexist to regulate blood flow • neuron-astrocyte pathway (Koehler et al., 2006) • vasomotor GABAergic interneurons (Cauli et al., 2004) • nitric oxide diffusion (Metea & Newman, 2006) • We use a generic blood flow-inducing signal that subsumes neurogenic and diffusive components (Friston et al., 2000) • A linear function of neural activity with signal decay and autoregulatory feedback from blood flow e=gain parameter u0=baseline synaptic activity tb=decay time constant fin=blood flow tf=feedback time constant
Vascular Signal Generation: Balloon Model • We use Friston & Buxton’s balloon model to simulate the vascular response to neural activity and generate simulated PET or fMRI signals
A New Synthetic Brain Imaging Model • Izhikevich neurons with realistic synaptic dynamics and noise • Total synaptic conductance for all synapses in a voxel used to generate to a generic blood flow-inducing signal • Use normalized blood flow-inducing signal as input to the Balloon model
Basic Network Architecture { Pyramidal Neuron Firing Rate (Hz) Membrane Potential (mV) 0 100 30 Response latency 0 Time (s) -50 2.0 -80 0 1 100 Neuron • Populations of pyramidal neurons and inhibitory interneurons • Center-surround connectivity implements winner-take-all dynamic • Depending on the input, there can be a considerable latency before the network settles on a stable winner
Example 1: Random Dot Motion Discrimination • The random dot motion direction discrimination task is commonly used to study perceptual decision-making • Task: saccade in the net movement direction of a field of randomly moving dots • Stimulus coherence: percentage of dots moving in the same direction • This task is useful in demonstrating the power of synthetic brain imaging because • A well-defined network of brain regions is involved (MT, LIP, FEF) • There exists neural recording, microstimulation, behavioral and imaging data using the task in humans and non-human primates
Model Derivation • We used three connected WTA networks to simulate the MT-LIP-FEF network • Neural parameters were set using values from experimental data • Network parameters were set using a genetic algorithm that used the model’s fit to neural recording and behavioral data as the fitness function (Gold & Shadlen, 2007)
Results: Neural Activity Stimulus Coherence 3.2% 12.8% 51.2% • Pyramidal neurons in LIP converge on a population code centered on the chosen saccade direction • Response time was interpreted as the time taken for max firing rate in FEF to reach 100Hz (Hanes & Schall, 1996)
Results: Behavioral Measures Model Performance Human Behavioral Data (Palmer et al., 2005) • Response time and accuracy were fit to the same psychometric and chronometric functions used to analyze human data • Fitted parameters were within the range of human performance
Results: Microstimulation Simulations Simulation Results Monkey Data Control MT Stim LIP Stim (Hanks et al., 2006) • MT microstimulation biased decision process and reaction time • LIP microstimulation had the same effect, but to a lesser extent • The same results are found in monkey microstimulation experiments
Results: Synthetic fMRI Synthetic fMRI Human fMRI MT LIP FEF (Rees, Friston & Koch 2000) • The model replicated human fMRI data that only found a positive correlation between BOLD response and stimulus coherence in MT • In the model this is because intraregional processing (WTA) dominates LIP and FEF activity and is roughly the same at each coherence level
Example 1: Summary • A basic neural microcircuit was connected in a network based on anatomical considerations • Neural parameters were set using values from experimental data. Network parameters were set using a genetic algorithm that fit the firing rate and model behavior to neural recording and psychophysical data • The model was validated by replicating microstimulation and fMRI studies
Example 2: Reach Target Selection • We developed a model of the parieto-frontal reach circuit with each region based on macaque neurophysiological data and interregional connections constrained by tract-tracing studies • The output of the dorsal premotor region was decoded and used to control a simulated arm/hand
Synthetic PET: Comparison with Experimental Data 0.8 Signal % Change 0.4 0.0 F2 F6 LIP V6A PFC V4 F2 F6 LIP V6A PFC V4 • % change in rCBF in F2, F6, V6a, and PFC matches published neuroimaging data (Savaki et al., 1997, left) • Differences in activity in V4 highlight a PFC→V4 connection overlooked in model construction • Updated model activity closely matches published data (right)
Example 2: Summary • A virtuous cycle of models and experiments • We used available connectivity and neural recording data to develop a model of reach target selection • Synthetic brain imaging was used to compare the global model activity to metabolic signals in the monkey brain • This comparison was used to update the model to include feedback connections from PFC to V4
Example 3: Imaging of a Cognitive Model of Apraxia Red: visuo-gestural coding Green: input praxicon Blue: output praxicon Peigneux et al (2004) • Looked at familiar vs novel gesture imitation • Found that brain areas associated with gesture recognition and production were not more active for familiar vs novel imitation
Example 3: Summary • A model of gesture recognition and imitation was used to generate PET predictions that conflict with those generated in an ad-hoc manner using a conceptual model • The model is simple, but nonetheless more complex than the conceptual one used by experimentalists • Data necessary to constrain the model do not exist – the model demonstrates one possibility • In this situation multiple competing models should be developed and used to determine an experiment that could disambiguate them
Summary • Synthetic imaging can bridge the gap between electrophysiology and neuroimaging • We gave three examples using this technique to • Validate a neural model • Refine a neural model • Offer a novel interpretation of experimental data • Future studies could use this technique to generate predictors for fMRI analysis
Thank you • Arbib Lab • Rob Schuler • Itti Lab • David Berg • Farhan Baluch • Funding • NSF • Sloan Foundation