Download
1 / 26
260 likes | 413 Vues
Peak Oil The Forward End of the Curve. Presentation to the City of Madison April 10, 2006 By Mark Daugherty Focus On Energy Renewable Energy Business Development. This presentation is funded in part by Focus on Energy. Oil and Gas Supply.

E N D
Peak Oil The Forward End of the Curve Presentation to the City of Madison April 10, 2006 By Mark Daugherty Focus On Energy Renewable Energy Business Development This presentation is funded in part by Focus on Energy.
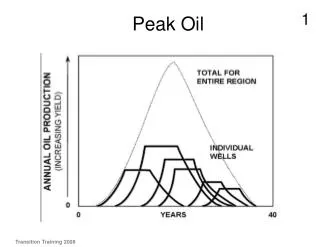
Global oil discoveries are following a typical bell shaped curve. 2003 first year since 1920s no single discovery > 500 million barrels. (No single field found large enough to meet demand for 1 week.)* Note: Global data shown here is reported by ExxonMobil, it is consistent with many others. See: Harry J. Longwell, executive VP of Exxon-Mobil corporation, http://www.energybulletin.net/primer.php, http://www.feasta.org/documents/wells/contents.html?one/longwell.html and C.J.Campbell, ASPO http://www.peakoil.net/, http://www.peakoil.ie/downloads/newsletters/newsletter35_200311.pdf * IHS Consultants at http://www.ihsenergy.com/
Global conventional oil production peak estimated in 2006 to 2008 timeframe. Data Forecast From the Association for the Study of Peak Oil (ASPO) 2004 See also: Global Oil and Gas Depletion: an Overview, R.W. Bently, Energy Policy 30 (2002) 189-205. Congressman Rosco Bartlett (R-6-MD), Congressional Record, March 14, 2005, Pages H1409-H1414. http://www.bartlett.house.gov/SupportingFiles/documents/PeakOil.pdf
(Billion Barrels / Yr) Current demand is beginning to hit physical supply constraints Gap V1 V2 V1 = V2 From the Association for the Study of Peak Oil (ASPO) 2002. Excellent Summary on Peak Oil: Congressman Rosco Bartlett (R-6-MD), Congressional Record, March 14, 2005, Pages H1409-H1414. http://www.bartlett.house.gov/SupportingFiles/documents/PeakOil.pdf
Natural Gas : US, Canada & Mexico Discoveries and Production Discovery curve shifted 23 years. V1 V2 V1 = V2 See: http://www.peakoil.net/JL/JeanL.html
In 2002 Oil and Gas made up 62% of global primary energy supply. Source International Energy Agency (IEA) http://www.iea.org/statist/index.htm
What about non - conventional fossil fuel supplies? • Technologies include: tar sands, oil shale, heavy oil, gas to liquids technology • Like trying to drink through a smaller and smaller straw. • Lower energy return, Extensive environmental damage. • Strip mining + heating or steam injection. • 1.5-2 tons material processed per barrel of oil. • Bottom line: higher cost, smaller volume ~ 10 times current global coal mining required to meet present oil needs with tar sands or oil shale.
Historical Primary Energy Substitution http://www.pewclimate.org/docUploads/snowmass%5Fnakicenovic%2Epdf
Possible Global Energy Supply (2005-2100) Coal Gas Oil Renewable Nuclear For background data see: http://www.eia.doe.gov/, http://www.eia.doe.gov/emeu/international/gas.html, http://www.eia.doe.gov/neic/infosheets/coalreserves.htm, http://www.iea.org/, http://www.euronuclear.org/info/encyclopedia/u/uranium-reserves.htm, http://www.peakoil.net/
Possible Cumulative Global Energy Supply (2005-2100) For background data see: http://www.eia.doe.gov/, http://www.eia.doe.gov/emeu/international/gas.html, http://www.eia.doe.gov/neic/infosheets/coalreserves.htm, http://www.iea.org/, http://www.euronuclear.org/info/encyclopedia/u/uranium-reserves.htm, http://www.peakoil.net/
Burning fossil fuels generates greenhouse gas emissions driving climate change. Minimum Artic Ice 1979 Minimum Artic Ice 2005 Ice ~ 43% thinner in 1996 than in 1976 Inage: MSNBC, Associated Press, Sept. 29, 2005 http://www.msnbc.msn.com/id/9527485/ Thinning: Professor Peter Wadhams, Scott Polar Research Institute, Cambridge, UK, BBC news, Wednesday, 27 March, 2002 http://news.bbc.co.uk/2/hi/science/nature/1894740.stm
Antartica - Collapse of Larsen B Ice Shelf 31 January, 2002 5 March, 2002 • 3,250 km2 of shelf area disintegrated. • Glacier speeds increased ~ 250% after collapse. National Snow and Ice Data Center http://nsidc.org/iceshelves/larsenb2002/ http://nsidc.org/news/press/20031219_speed_up.html
Extent of ice melt in Greenland, 1992 and 2002 John P. Holdren, Harvard University, Co-Chair National Commission on Energy Policy, 2005 Institutional Investor Summit on Climate Risk,United Nations • New York •10 May 2005, citing Arctic Climate Impact Assessment 2004
Impact of Melting Ice GIS = Greenland Ice Sheet WAIS = West Antarctic Ice Sheet EAIS = East Antarctic Ice Sheet (Estimated time scale is several centuries.) +7 m +12 m +70 m From a presentation by Richard B. Alley, U. of Pennsylvania, Cited by John P. Holdren, Harvard University, Co-Chair National Commission on Energy Policy, 2005 Institutional Investor Summit on Climate Risk,United Nations • New York •10 May 2005, citing Arctic Climate Impact Assessment 2004
Greenhouse Gas emissions for advanced generation (2010-2020) technologies. Greenhouse Gas Emissions of Electricity Generation Chains, Joseph Spadaro, Lucille Langlois and Bruce Hamilton, IEA Bulliten 42/2/2000
Three options to meet demand for carbon-neutral energy • Fossil fuel with carbon sequestration • 25 billion metric tons of CO2 produced annually • Equal to the volume of Lake Superior • 1% leak rate would nullify sequestration in a century • Nuclear power • 10 TW of nuclear power = a new 1-GWe plant every 2 days for the next 50 years. • Then terrestrial uranium exhausted in 10 years. • Renewable energy • Exploitable hydroelectric < 0.5 TW • Tides and ocean currents < 2 TW • Geothermal energy << 12 TW • Wind potential ~ 2-4 TW • Solar ~120,000 TW strikes the Earth • 10% efficient solar energy “farm” covering 1.6% of the U.S. land area would meet the country’s entire domestic energy needs (2005 Global Consumption ~ 14 TW) • Comparable with the land area covered by the nation’s federally numbered highways. Source: US DOE BASIC RESEARCH NEEDS FOR SOLAR ENERGY UTILIZATION Report on the Basic Energy Sciences Workshop on Solar Energy Utilization, April 18-21, 2005
Possible Cumulative Global Supply with Coal Restriction For background data see: http://www.eia.doe.gov/, http://www.eia.doe.gov/emeu/international/gas.html, http://www.eia.doe.gov/neic/infosheets/coalreserves.htm, http://www.iea.org/, http://www.euronuclear.org/info/encyclopedia/u/uranium-reserves.htm, http://www.peakoil.net/
It will be difficult to meet current energy demand growth indefinitely. Demand at 1.8%/yr growth Total energy supply from previous slide.
Effort is required on 2 fronts • Reduce energy consumption growth • Use efficiency and conservation • Economic growth still possible • Develop non-fossil fuel supplies • Solar electric, wind, solar thermal, biomass • Grid, storage, forecasting and control optimized for non-fossil fuel supply utilization.
Front 1:Increasing efficiency and conservation by 1.8% per yr Stabilize demand growth. Allow economic growth. Demand at 1.8%/yr growth Efficiency and conservation Stable demand Supply
Front 2:Increase renewable energy supply Renewable energy supply Conventional Supply
Current renewable energy growth rates exceed those required to transition to a fully renewable energy supply. • 2004 investment in renewables ~ US $30 billion • Investment in entire power generation sector ~ $150 billion • Renewable energy capacity to 160 GW ~ 4% of global power. http://www.ren21.net/globalstatusreport/RE2005_Global_Status_Report.pdf http://www.earthscan.co.uk/news/article/mps/uan/508/v/3/sp/ IEA: http://www.oja-services.nl/iea-pvps/ AWEA: http://www.awea.org/pubs/documents/globalmarket2003.pdf
How should we invest the remaining fossil energy? Electrical Generation Liquid Fuel Production Output Input Energy Input Energy Output Coal Ethanol Nat. Gas Bio Diesel Solar (PV) (30 to 80 depending on site and technology) Wind Note: Coal and Natural Gas energy output limited to combustion efficiency at a maximum. Fuel supply, plant construction and decommissioning, and O&M energy uses reduce output below combustion efficiency. Solar, wind and bio can have terrestrial energy output greater than one since they are accessing solar energy entering the terrestrial system from the sun. See: http://www.awea.org/faq/bal.html, http://www.ecotopia.com/apollo2/knapp/PVEPBTPaper.pdf
What might a Wisconsin Renewable energy supply look like? Notes: This is a rough estimate, only intended to show magnitudes. Wisconsin current electrical generation capacity ~12,000 MW. Wind is not necessarily all located in Wisconsin. Wind at 27% capacity factor. Solar at 1250 kWh/yr per rated kW output.