Insights into Demographics: A Study of Population and Impacts
Explore the world population data, census limitations, migration effects, demographic revolution, transition models, and age structures. Learn about birth rates, death rates, and the impact of migration on population growth.

Insights into Demographics: A Study of Population and Impacts
E N D
Presentation Transcript
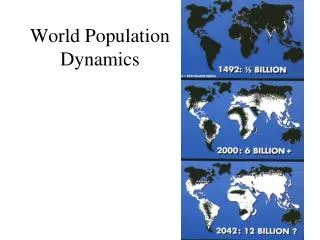
World Population: Study in Demographics:
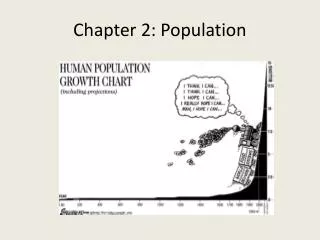
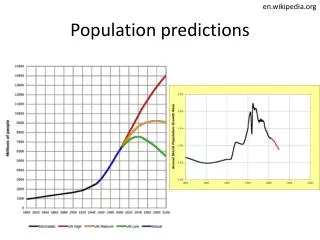
Some basic facts • Current World Population is 6.6 billion • 2050 projection is 8.2 billion to 11 billion • Between 8000 BCE to 750 AD about 70,000 people were added each year • Today about 70,000 people will be added in less than 7 hours • What does this all mean? • What effects will population increase have?
Demographics • The statistical study of Human population • Helps us understand the cause & consequences of growth • Information is collected in National Census • Total process of collecting, compiling, and publishing demographic, economic, and social data pertaining to a particular time, to all persons in a particular country
Census • In Canada - full census every 10 years • Half census every 5 years • 1. Census data is used to predict the future of the country • a. Taxes, Social Service, areas of growth, areas of decline • i. Easier in developed countries than developing countries • Predict any population changes
Population • Demographers are most interested in population changes • Components of population change • How many people are born • How many die • How many move into the area • Not very useful to compare between Developed and Developing Country • Social economic differences
Limitations to the Census • Rarely completely accurate • No permanent address • Fear of taxation or authorities • Births or deaths that are not recorded • Illiteracy • Areas are missed due to remoteness • In some case the error could be as high as 30%
Population Formula • Birth-Deaths+Immigrants-Emigrants=increase or decrease in population • # of births in a year \ total population X 1000 = crude birth rate • The same is done for the crude death rate • Doubling time = the # of years it take to double the population --- Rule of Seventy • 70 divided by the growth rate = # of years to double
The Effects of Migrations • Many countries depend on immigrants to increase its population (mostly developed countries) • Emigration and Immigration Rates are calculated the same way as birth and death rates • Birth Rate - Death Rate +- Net Migration Rate (NMR) = the Population growth Rate • Migration rate affects a country because most immigrants are young, single males---increase in birth rate but the reverse effect for the county losing the immigrants
Effect of Migration • Increase in Immigrants = taxes and growth potential • Influx of different cultures = gov’t responsibility to include the new populous • For Canada most of the immigrants that come to Canada are from developing countries, wanting a better standard of living
Demographic Revolution • Most of history birth rate was high - expect for the elite - LIFE EXPECTANCY = 30 • Disease, poor medical, bad nutrition, and bad living conditions • Families needed to be large to ensure survival, and provide money and food • Conditions that are still occurring today in many developing countries
Demographic Revolution • After 1750 the death rate started to decline in most countries • Due much to Agricultural Revolution • Improve hygiene and medical • Clean drinking water, vaccination • Birth Rate remained high while death rate dramatically decreased • Finally changed toward the beginning of the 20th Century - economical development, raising standard of living and cost of living.
Demographic Revolution • After WWII the WHO made economic and medical aid available to many of the developing countries of the world • Mostly in Africa - were not ready to deal with the economic and social impact of a population boom
Demographic Transition Model • Extremely useful way to explain population change • Shows changes over a period of time in 3 elements • Birth rate • Death Rate • Trend in overall population growth • Assumes that countries will pass through periods of industrialization and urbanization that will reduces birth and death rate.
Demographic Transition Model • Stage 1 - High Birth Rate and high fluctuating death rate=low pop. Growth • Stage 2 - Improve health care and food supply=declining death rate, birth rate remain high = pop. growth • Stage 3 - Pop. Growth begin to slow - birth rate slows - industrialization and urbanization = less need to large families • Stage 4 - Low birth and death rate. Pop. May grow under special circumstances-”Baby Boom” • Stage 5 - Birth rate is below the death rate
Age Structure • Age Structure help us understand the reasoning for population change • Divided in 3 sections • 1-16 dependents • 17-64 adults • 65+ old age • Provides the dependency ratio= the population that needs to be supported by the working age • Put pressure on the working group for medical, education, housing, etc. • Provides insights to the problems that will come
Population Pyramids • Graph that shows the age and sex structure of a population - shown in 5 year intervals called cohorts • Used to compare the pop. structure of different countries • Expanding are developing countries and stable are developed countries
World Dependency • World Age Structure shows that there are more people in the dependency category now more than any other time in history • 25% of Japan’s population could be dependent by 2025-too little births • Developing countries have too many dependents in the children category • Lower birth rate is offset by the # of women • Too many children for the country to provide for • Huge unemployment group-threaten the stability of the region
Canada’s population • Last 30 years both the birth and death rate had been dropping • Life expectancy is 79 • Increasing the strain on the social l services • Age structure of Canada is forcing the Gov’t to increase the # of immigrates • 1991-1996 would have shrunk by 750000 but instead increased by 1.6 million • 1% of the pop. goal-well below that goal • Ideally want young, skilled workers & entrepreneurs • More $ is being used to process refugees than recruitment
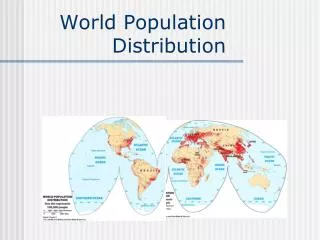
Population Distribution • The way people are spaced over the Earth • Ecumene=permanently inhabited places • 35% of the Earth is not usable for settlement • 50% of population live on 5% of the land • 90% live in 20% of the land • 66% live within 200km of the Ocean
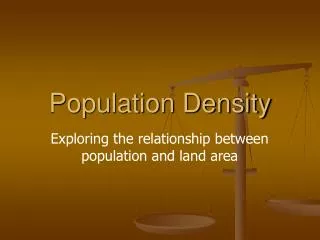
Population Distribution • Population Density is the # of people in a given area • Crude Density is the population divided by the total area of the country • Doesn’t account to distribution within the country • No indication of urban and rural
Land Usage • The measure of how much nutrition in calories can be produced from the land • Canada - 60 calories/km2 • China - 1192 calories/km2 • Affected by soil conditions and climate