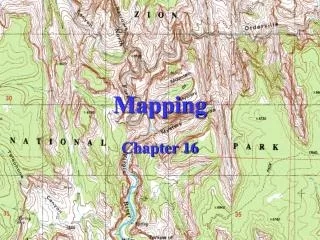
Mapping
Learn about Latitude, Longitude, Maps, and Map Projections. Understand how to determine locations on Earth. Explore different map types like Geologic and Topographic. Discover advancements in technology like GPS and Remote Sensing.

Mapping
E N D
Presentation Transcript
Where in the World is…? -A global grid was first established after Christopher Columbus proved the world was not flat. -This grid divides the Earth into degrees. Latitude and Longitude -Earth is a sphere, so its circumference is divided into 360 degrees.
Latitude -Latitude is the distance north or south of the equator and is measured in degrees. -Lines are parallel and run east to west. -Climbing a “ladder” when measuring latitude.
Longitude -Longitude is the distance east to west of the Prime Meridian expressed in degrees. -Non-parallel lines called meridians that from from the North to South pole. -0 degrees to 180 degrees E/W
Details -Details in the grid system are accomplished by dividing the degrees of Latitude and Longitude. -Degrees are divided into minutes. -Minutes into seconds.
http://mapssite.blogspot.com/2009/10/world-map-with-latitude-and-longitude.htmlhttp://mapssite.blogspot.com/2009/10/world-map-with-latitude-and-longitude.html
Practice Determine the latitude and longitude of… • Southern North Carolina. • Big Island of Hawaii. • Philadelphia.
Globes -3D representations of Earth. -Models of the Earth. Lack details, so they aren’t completely accurate. Show sizes and shapes of continents accurately. -Mapmakers first used globes because it was hard to make a 2D representation of Earth.
Maps -Globes would be too large to handle if they included all the small details. -We use maps to see roads, rivers, and streams. -Help us get from place to place.
How to make a sphere flat -Cartographers use map projections to move the image of the Earth’s curved surface onto a flat one. -Many different projections. -All map projections have problems, the biggest is distortion.
Mercator Projection -1569 -Latitude and Longitude lines are parallel, making the grid rectangular. -Directions shown accurately. -Still used today. https://www.britannica.com/science/Mercator-projection
Conic Projection -There is a little distortion over small areas. -Made by wrapping a cone of paper around a globe at a particular line of latitude. -Accurate around 40 degrees latitude. -Distortions occur North and South of 40 degrees. https://kids.britannica.com/students/assembly/view/166514
Robinson Projection -Most widely used. -Shows distances, sizes, and shapes accurately. -Distortions are seen around the edges of the map. https://en.wikipedia.org/wiki/Robinson_projection
Gnomonic Projection -Place a piece of paper on the globe’s surface at a single point. -Various points are projected. -Shows the shortest distance between two points. -Areas accurate, shapes distorted. http://www.progonos.com/furuti/MapProj/Normal/ProjAz/projAz.html
Map Information -Compass rose -Title -Scale -Legend -Date
Types of Maps -Maps represent different parts of the Earth. -Topographic maps show elevations. -Road maps represent man-made objects. -Geologic maps show rocks and minerals. -Maps are based on modern technologies.
Geologic Maps -Show the types of rocks and minerals in an area. -Also show the age of the rocks in the area. -The ages of the rocks is shown through the use of different colors on the map. -Often they combine with date from topographic maps. https://deq.nc.gov/about/divisions/energy-mineral-land-resources/north-carolina-geological-survey/interactive-geologic-maps
Topographic Map -Show elevations of natural and man-made objects. -Areas of equal elevation are connected by contour lines. -Contour lines are closer together on steep inclines, and further apart on flat ground. -Circles with tick mark represent a depression. https://www.google.com/maps/place/Danbury,+NC/data=!4m2!3m1!1s0x88525a470e470b2f:0x6125d737ffdf04be!5m1!1e4?sa=X&ved=0ahUKEwiXwbu2zLzYAhWjQ98KHdCDAjAQ8gEIJTAA
Modern Technology -Technology has changed how we generate and use maps. -Computers now generate maps. -Technology has also developed new types of maps. https://www.mapquest.com/
Remote Sensing -Process of gathering and analyzing information about an object without physically being there. -Began with the camera. -Use satellites or radar. http://geodata.lib.ncsu.edu/fedgov/noaa/commvuln/htm/ccap5.htm
Satellite Imagery -Uses orbiting satellites to take pictures of Earth from space. -A part of remote sensing. https://weather.com/storms/winter/news/2018-01-04-satellite-images-of-winter-storm-grayson
Global Positioning Systems -A system of orbiting satellites that send radio signals to receivers to calculate a given places, latitude, longitude, and elevation. -Used in navigation. -Cartographers use GPS to determine exact boundary lines. https://www.youtube.com/watch?v=FU_pY2sTwTA
Geographic Information Systems -A computerized system that allows a user to enter different types of information about an area. -Used to store, use, and view geographic information. -Used to make complicated analyses or display maps. http://maps2.roktech.net/StokesGoMaps4/ https://researchguides.library.wisc.edu/GIS