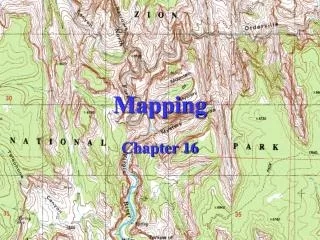
Mapping
Mapping. Maps – What Can They Tell Us?. The shape of the land Direction of water flow in a river or stream Slope of the land Weather patterns. Maps. All maps have fields, which are regions of space or areas that have a measurable value of a given property.

Mapping
E N D
Presentation Transcript
Maps – What Can They Tell Us? • The shape of the land • Direction of water flow in a river or stream • Slope of the land • Weather patterns
Maps • All maps have fields, which are regions of space or areas that have a measurable value of a given property. • Isolines – Lines on a field map connecting all points of equal value • Isobars – connect points of equal air pressure • Isotherms – connect points of equal temperature • Contour Lines – connect points of equal elevation
Isoline Rules • Lines must connect equal points in equal intervals • If there is not a point for a given interval, you must draw the isoline where it would fit. • Isolines must either close or run off the map • Isolines can never touch
Practicing Isolines • 1. Draw elevation isolines for 40, 50, 60, 70, & 80 feet. • 2. What is the approximate elevation of point: • Point A • Point B • Point C 71-79 feet 41-49 feet 51-59 feet Elevation measured in feet
Practicing Isolines • What measurable property is shown on this map? • Based on this property, the isolines on this map are called • What is the approximate measurement of this property for New York State? Temperature Isotherms 5°C
Practicing Isolines – Average Yearly Number of Thunderstorms in the US • Approximately how many thunderstorms occur each year in: • Albany, NY • Los Angeles, CA • New Orleans, LA 20-30 >10 <70
Topographic Maps – Maps of an Elevation Field • Topographic Maps show the elevation of the land by using contour lines, and show other natural and man-made features by using symbols. • Contour Lines – isolines on a map connecting points of the same elevation • Elevation – distance (feet) above sea level • Contour Interval – difference in elevation between two consecutive contour lines • Index Contour Line – heavy, dark contour line, usually with numerical value for elevation marked • Depression – special contour lines used to show a hole or crater on Earth’s surface.
Depressions http://www.iihr.uiowa.edu/~illman/courses/eg/webslides/12-179%20Part3%20Topo%20and%20Geomap%20Spr07.pdf
http://www.iihr.uiowa.edu/~illman/courses/eg/webslides/12-179%20Part3%20Topo%20and%20Geomap%20Spr07.pdfhttp://www.iihr.uiowa.edu/~illman/courses/eg/webslides/12-179%20Part3%20Topo%20and%20Geomap%20Spr07.pdf
What is the contour interval? • What is the highest possible elevation of the hilltop? • Which side of the hill is the steepest? • How do contour lines show a steeper slope? 20 feet Contour Lines 259 feet East/right The contour lines are closer together Depression Contour Index Contour
River Valleys – The Law of the V’s • Contour lines form a V pattern when crossing streams. • The V always points UPSTREAM
Which way is the stream flowing? Downstream (Downhill) http://www.iihr.uiowa.edu/~illman/courses/eg/webslides/12-179%20Part3%20Topo%20and%20Geomap%20Spr07.pdf
Drawing Contour Lines on a Field Map – 20, 40 ,60, 80, 100, 120 feet
Calculating Gradient • Gradient is the rate at which elevation changes from place to place. • Gradient = change in field value distance
Calculating Gradient • Use the elevation field map that you drew contour lines on to calculate the gradient between: • Point A & C • Gradient = Gradient = 110-20 ft 3.5 miles 25.7 ft/mile
123 – 13 ft 3 miles • Point B & D • Gradient = Gradient = • Point B & E • Gradient = Gradient = • Point F & C • Gradient = Gradient = • 36.7 ft/mile 123-80 ft 1.5 mile 28.7 ft/mile 27-20 ft 1.5 mile • 4.7 ft/mile
Parts of a Map Parts of a Map: • Scale – relates distance on the Earth’s surface and is often given as a ratio. • Map Key – a list of all the symbols used on a map with an explanation of their meaning. • Symbols – pictures used to describe a feature on Earth’s surface.
Let’s keep going! 100m
Now we’re at 200m. 200m 100m
Shall we march on? 200m 100m
We’ve made it to 300m! 300m 200m 100m
On to the peak! 300m 200m 100m
We’re on the peak, but what’s our elevation? 300m 200m 100m
Any ideas? Let’s add contour lines for every 50 meters and see if that helps. 300m 200m 100m
We know that we are above 350m, but less than 400m. 350m 300m 250m 200m 150m 100m 50m
Let’s head down the hill, it’s getting late! 350m 300m 250m 200m 150m 100m 50m
Now what’s our elevation? If you said somewhere between 200m and 250m you are right! 350m 300m 250m 200m 150m 100m 50m
Let’s try this again! 350m 300m 250m 200m 150m 100m 50m
What’s our elevation now? If you said 50m or just under, you’re right! 350m 300m 250m 200m 150m 100m 50m
Let’s now look at the same hill, but the way we might see it from an airplane!
If you said more than 150 meters, but less than 200 meters your right!
Think you know our elevation now? More than 300 meters But less than 350 meters
If we were standing on the peak, what would be our elevation? • More than 350 meters, less than 400 meters
More than 100 meters, less than 150 meters
Let’s see what you know. E C D B 1200m F 1000m A 800m 400m 600m
Quiz Time Grab a piece of paper and write your answers to the following questions. Ready?
1. Could the elevation at the peak (B) be 1410 meters? E C D B 1200m F No :The elevation must be under 1400 meters, but over 1300 meters. 1000m A 800m 400m 600m
2. What is the elevation at (E)? 400 meters E C D B 1200m F 1000m A 800m 400m 600m
3.What is the elevation difference between (A) and (B)? E C D B 1200m F (A) Is 750 meters, (B) is above 1300 meters. The difference between would be 650 to 700 meters. 1000m A 800m 400m 600m
4. Could the elevation at (F) be 417 meters? No: It must be more than 700m and less than 800m E C D B 1200m F 1000m A 800m 400m 600m