Download

1 / 24
240 likes | 268 Vues
This study aims to apply Principal Component Analysis (PCA) to the color spectra of natural scenes to identify underlying components. The research utilizes spectral data collected from Jackson Gardens, focusing on open areas, shady spots, and a mixture of both, along with maple leaves. Through PCA, significant eigenvalues and eigenvectors are identified, paving the way for future work on relating these to real spectra and exploring Independent Component Analysis (ICA). The project makes use of a portable laptop, spectrophotometer, and Matlab for data analysis.

E N D
Principal componentanalysis of the color spectra from natural scenesLong Nguyen ECE-499 Advisor: Prof. Shane Cotter
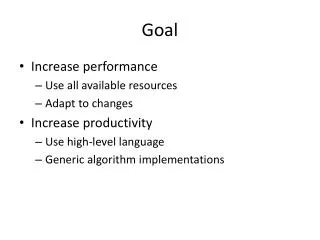
Goal • We wish to determine if there is some small number of underlying components (basis functions) which can be linearly combined to produce the wide variety of spectral data observed in nature
Equipments • Portable laptop • Spectrophotometer • Matlab
Collection of Spectral data • Summer in Jackson Gardens
Collection of Spectral data • Jackson Gardens: • 120 samples of natural color spectrums.
Collection of Spectral data • Jackson Gardens: • 120 samples of natural color spectrums. • 40 samples in open area, 40 in the shade area, and 40 in mixture of both (Up and sideway)
Collection of Spectral data • Jackson Gardens: • 120 samples of natural color spectrums. • 40 samples in open area, 40 in the shade area, and 40 in mixture of both (Up and sideway) • Leaves:
Collection of Spectral data • Jackson Gardens: • 120 samples of natural color spectrums. • 40 samples in open area, 40 in the shade area, and 40 in mixture of both (Up and sideway) • Leaves: • 60 samples of maple leaves
Calibration • Aim beam of light with known intensity at the sensor
Calibration • Aim beam of light with known intensity at the sensor • Convert all garden measurements into radiance (mol/m2/s/sr/nm)
Mathematical Analysis • Principal Component Analysis (PCA)
Mathematical Analysis • Principal Component Analysis (PCA) • PCA is a technique used to reduce multidimensional data sets to lower dimensions for data compression.
Mathematical Analysis • Principal Component Analysis (PCA) • PCA is a technique used to reduce multidimensional data sets to lower dimensions for data compression. • PCA extracts components which are orthogonal to one another. The first component accounts for the greatest variance observed in the data, the second component accounts for variance in an orthogonal direction, and so on until the data is completely accounted for.
PCA • Data Covariance Matrix Eigenvalues & Eigenvectors
Eigen values • 11 Significant Eigen values
Eigen values • 11 Significant Eigen values • 0.0001 0.0001 0.0002 0.0002 0.0003 0.0017 0.0085 0.0118 0.0740 0.4586 48.8719
Future Work • Relate eigenvectors to real spectra • Analyze the leaves data • Independent Component Analysis (ICA)
Acknowledgements • Prof. Shane Cotter • Prof. Fleishman