Earthquakes
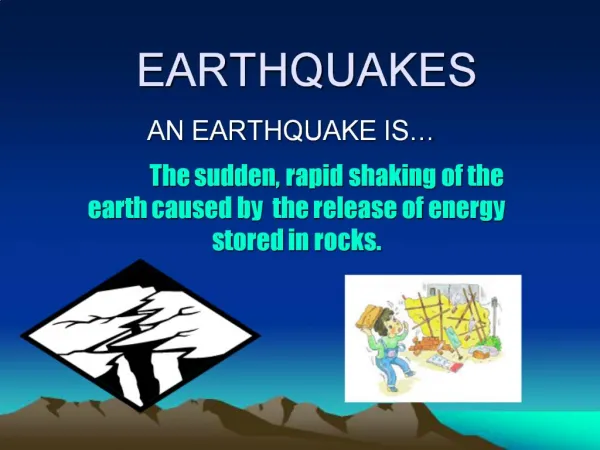
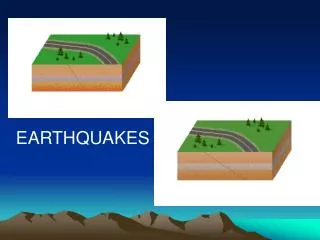
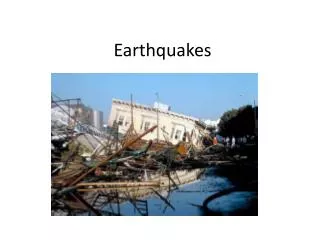
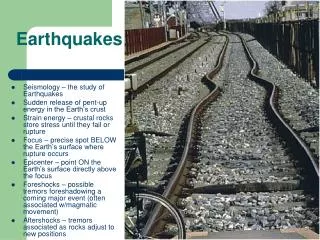
Earthquakes. Earthquake Basics. Earthquake – shaking of Earth’s crust caused by the sudden release of energy Energy build over time until stresses break the rocks Happen ~ every 30 seconds ~3,000 annually strong enough to move sections of Earth’s crust ~20 annually cause severe damage

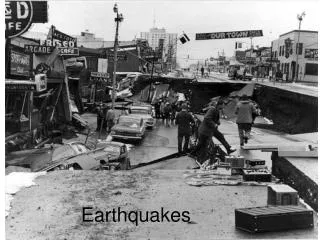
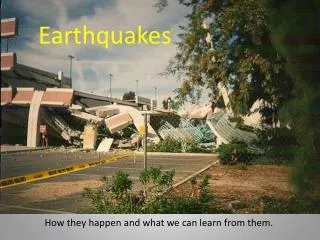
Earthquakes
E N D
Presentation Transcript
Earthquake Basics • Earthquake – shaking of Earth’s crust caused by the sudden release of energy • Energy build over time until stresses break the rocks • Happen ~ every 30 seconds • ~3,000 annually strong enough to move sections of Earth’s crust • ~20 annually cause severe damage • Can only occur in the rigid crust!
Causes • Elastic Rebound Theory – • Pressure and stress begin to build along plate or fault boundaries • Pressure causes deformation and shape changes in rock • Stress becomes great enough to overcome friction • Plate or fault suddenly move • Plate or fault snap back to previous shape
Earthquake Definitions • The point on the fault plane at which the first movement of the earthquake occurs • The point on the earth’s surface directly above the focus of the earthquake • A break or crack in the earth’s crust from which movement occurs. • Focus or Hypocenter • Epicenter • Fault
Seismic Waves • Travel & act much like sound waves • 2 basic types • Body Waves (2 types) • Compressional, Primary or P wave • Shear, Secondary or S wave • Surface waves (2 types) • Product of P & S waves reaching the surface • Love or L Waves • Rayleigh waves
P Waves • Fastest traveler • 1st to be recorded • Travel through all materials (rock, fluids, air) • Move straight along ground in an accordion fashion like a spring or slinky
S Wave • 2nd fastest wave • Travels ~1/2 speed of P wave • Particles move at right angles to the direction of travel • Only move in solids • Cannot move in fluids or air
Love Waves • Slower than both P & S waves • Travel like ripples in a pond • Very destructive!!!
Time Travel Graph • A time travel graph is used to find the distance to the epicenter.
Time Travel Graph questions. • 1a. If an earthquake occurred near where you live, would P waves or S waves arrive at your location first? • b. Explain your answer. • 2a. How long would it take for a P wave to travel from an earthquake epicenter to a location 8000 km away? • b. How long would it take for an S wave to travel the same distance. • 3. Approximately how far must an observer be from an earthquake epicenter if he or she received a P wave 8 minutes after it was produced by the earthquake. • 4. Explain how you could tell which of two observers was farthest from an earthquake epicenter by comparing the arrival times of P and S waves for the two locations.
Do Earth quake lab #1 • Finding the distance to the epicenter.
Locating an Earthquake The Basics of Seismic Exploration
seismograph- instrument used to measure Earth’s movements. • The pattern of seismic waves produced by a seismograph = seismogram • Richter Scale- measures earthquake’s magnitude (size of earthquake/amount of seismic waves)
Missoula Denver San Francisco
Seismograph Print-outs Guide to reading a seismogram
Use the data from the recording stations: • Station A:San Francisco, California P-Wave arrival 3:02:20S-Wave arrival 3:06:30 What is the time difference between P and S wave arrivals? 4:10
Use the data from the recording stations: • Station B:Denver, Colorado P-Wave arrival 3:01:40S-Wave arrival 3:05:00 What is the time difference between P and S wave arrivals? 3:20
Use the data from the recording stations: • Station C: Missoula, Montana P-Wave arrival 3:01:00S-Wave arrival 3:03:00 What is the time difference between P and S wave arrivals? 2:00
Difference in arrival times: San Francisco: 4:10 Denver, Colorado: 3:20 Missoula, Montana: 2:00
MOVE THE PAPER UNTIL THE TWO TICK MARKS LINE UP WITH THE P AND S CURVES WHEN TICK MARKS LINE UP, GO STRAIGHT DOWN AND READ THE EPICENTER DISTANCE EPICENTER DISTANCE OF 2800 KM
Recording BoardDifference in arrival times: San Francisco: 4:10 =2,800km Open your compass to the EXACT distance on the scale. 3,000 4,000 5,000 2,000 1,000
EPICENTER DISTANCES San Francisco: 4:10 2,800km Denver, Colorado: 3:20 2,000km Missoula, Montana 2:00 1,100km
Use your carefully set compass to draw a circle around each city. . 1,100km . . 2,800km 2,000km You've found the epicenter! Triangulation
How are the Size and Strength of an Earthquake Measured? • Magnitude • Richter scale measures total amount of energy released by an earthquake; independent of intensity • Amplitude of the largest wave produced by an event is corrected for distance and assigned a value on an open-ended logarithmic scale
Site #1 Dist = 300km Amp = 50mm Site #2 Dist = 600km Amp = 5mm Site #3 Dist =100km Amp = 500mm