Download
1 / 1
10 likes | 89 Vues
Explore rest-frame optical spectra of high-redshift quasars using AKARI telescope. Analyze SMBH masses and UV mass estimators. Discuss mass evolution and correlation with emission lines.

E N D
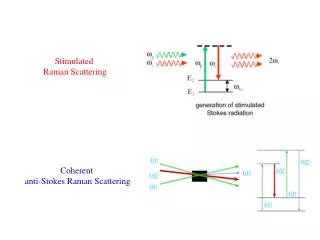
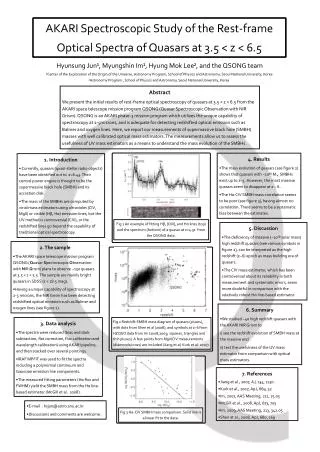
AKARI Spectroscopic Study of the Rest-frame Optical Spectra of Quasars at 3.5 < z < 6.5 Hyunsung Jun¹, Myungshin Im¹, Hyung Mok Lee², and the QSONG team ¹Center of the Exploration of the Origin of the Universe, Astronomy Program, School of Physics and Astronomy, Seoul National University, Korea ²Astronomy Program , School of Physics and Astronomy, Seoul National University, Korea Abstract We present the initial results of rest-frame optical spectroscopy of quasars at 3.5 < z < 6.5 from the AKARI space telescope mission program QSONG (Quasar Spectroscopic Observation with NIR Grism). QSONG is an AKARI phase-3 mission program which utilizes the unique capability of spectroscopy at 2-5microns, and is adequate for detecting redshifted optical emission such as Balmer and oxygen lines. Here, we report our measurements of supermassive black hole (SMBH) masses with well calibrated optical mass estimators. The measurements allow us to assess the usefulness of UV mass estimators as a means to understand the mass evolution of the SMBHs. • 4. Results • The mass evolution of quasars (see figure 2) shows that quasars with ~10¹⁰ M⊙ SMBHs exist up to z~5. However, the most massive quasars seem to disappear at z ~ 6. • The Hα-CIV SMBH mass correlation seems to be poor (see figure 3), having almost no correlation. There seems to be a systematic bias between the estimates. • 1. Introduction • Currently, quasars (quasi-stellar radio objects) have been identified out to z=6.43. Their central power engine is thought to be the supermassive black hole (SMBH) and its accretion disk. • The mass of the SMBHs are computed by virial mass estimators using ultraviolet (CIV, MgII) or visible (Hβ, Hα) emission lines, but the UV method is controversial (CIV), or the redshifted lines go beyond the capability of traditional optical spectroscopy. • 5. Discussion • The deficiency of massive (~10¹⁰ solar mass) high redshift quasars (see various symbols in figure 2), can be interpreted as the high redshift (z~6) epoch as mass building era of quasars. • The CIV mass estimator, which has been controversial about its reliability in both measurement and systematic errors, seem more doubtful in comparison with the relatively robust Hα line-based estimator. • 2. The sample • The AKARI space telescope mission program QSONG (Quasar Spectroscopic Observation with NIR Grism) plans to observe ~150 quasars at 3.5 < z < 5.5. The sample are mainly bright quasars in SDSS (z < 18.5 mag). • Having a unique capability of spectroscopy at 2-5 microns, the NIR Grism has been detecting redshifted optical emission such as Balmer and oxygen lines (see figure 1). Fig 2 Redshift-SMBH mass diagram of quasars (pluses), with dots from Shen et al (2008), and symbols at z~6 from HZQSO data from Im (2008,2009; squares, triangles and thin pluses). A few points from MgII/CIV measurements (diamonds/cross) are included (Jiang et al; Kurk et al. 2007). • 6. Summary • We studied ~40 high redshift quasars with the AKARI NIR Grism to • i) see the redshift evolution of SMBH mass at the massive end • ii) test the usefulness of the UV mass estimator from comparison with optical mass estimators. • 3. Data analysis • The spectra were reduced (bias and dark subtraction, flat correction, flux calibration and wavelength calibration) using AKARI pipeline, and then stacked over several pointings. • IRAF MPFIT was used to fit the spectra including a polynomial continuum and Gaussian emission line components. • The measured fitting parameters (Hα flux and FWHM) yield the SMBH mass from the Hα line-based estimator (McGill et al. 2008). Fig 3 Hα-CIV SMBH mass comparison. Solid line is a linear fit to the data. • 7. References • Jiang et al., 2007, AJ, 134, 1150 • Kurk et al., 2007, ApJ, 669, 32 • Im, 2007, AAS Meeting, 211, 75.05 • McGill et al., 2008, ApJ, 673, 703 • Im, 2009, AAS Meeting, 213, 342.05 • Shen et al., 2008, ApJ, 680, 169 • E-mail : hsjun@astro.snu.ac.kr • Discussions and comments are welcome. Fig 1 An example of fitting Hβ, [OIII], and Hα lines (top) and the spectrum (bottom) of a quasar at z=4.51 from the QSONG data.