Decision Tree Analysis of Hepatocellular Carcinoma and Extra-Hepatic Cancer Patients
This study presents decision tree algorithms for analyzing patients with hepatocellular carcinoma (HCC) and extra-hepatic cancer. Supplementary Figures detail patient distribution based on various criteria, including demographics and hormone treatment. Group classifications are based on Hepatitis B and C status, age, and insulin use. Pie charts illustrate the proportions of patients with and without HCC across different groups. This analysis aims to inform clinical decisions and improve patient outcomes by highlighting key risk factors.

Decision Tree Analysis of Hepatocellular Carcinoma and Extra-Hepatic Cancer Patients
E N D
Presentation Transcript
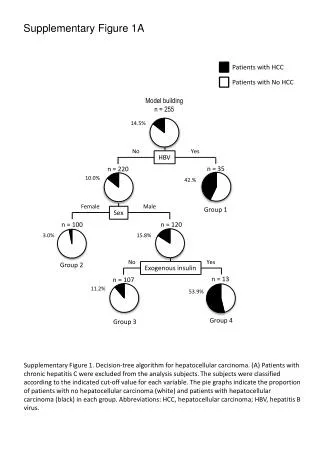
Supplementary Figure 1A Patients with HCC Patients with No HCC Model building n = 255 14.5% Yes No HBV n = 35 n = 220 10.0% 42.% Male Female Group 1 Sex n = 100 n = 120 3.0% 15.8% Yes No Group 2 Exogenous insulin n = 13 n = 107 11.2% 53.9% Group 4 Group 3 Supplementary Figure 1. Decision-tree algorithm for hepatocellular carcinoma. (A) Patients with chronic hepatitis C were excluded from the analysis subjects. The subjects were classified according to the indicated cut-off value for each variable. The pie graphs indicate the proportion of patients with no hepatocellular carcinoma (white) and patients with hepatocellular carcinoma (black) in each group. Abbreviations: HCC, hepatocellular carcinoma; HBV, hepatitis B virus.
Supplementary Figure 1B Patients with HCC Patients with No HCC Model building n = 220 10.0% Male Female Sex n = 100 n = 120 3.0% 15.8% Yes No Group 1 Exogenous insulin n = 13 n = 107 11.2% 53.9% Group 3 Group 2 Supplementary Figure 1. Decision-tree algorithm for hepatocellular carcinoma. (B) Patients with chronic hepatitis B and chronic hepatitis C were excluded from the analysis subjects. The subjects were classified according to the indicated cut-off value for each variable. The pie graphs indicate the proportion of patients with no hepatocellular carcinoma (white) and patients with hepatocellular carcinoma (black) in each group. Abbreviations: HCC, hepatocellular carcinoma.
Supplementary Figure 2A Patients with extra-hepatic cancer Patients with no extra-hepatic cancer Model building n = 255 12.9% < 81 years old ≥ 81 years old Age n = 239 n = 16 10.5% 50.0% Yes No Group 1 Sulfonylurea n = 206 n = 33 8.8% 21.2% Group 3 Group 2 Supplementary Figure 2. Decision-tree algorithm for extra-hepatic cancer. (A) Patients with chronic hepatitis C were excluded from the analysis subjects. The subjects were classified according to the indicated cut-off value for each variable. The pie graphs indicate the proportion of patients with no hepatocellular carcinoma (white) and patients with hepatocellular carcinoma (black) in each group.
Supplementary Figure 2B Patients with extra-hepatic cancer Patients with no extra-hepatic cancer Model building n = 220 13.6% < 81 years old ≥ 81 years old Age n = 204 n = 16 10.8% 50.0% Yes No Group 1 Sulfonylurea n = 174 n = 30 9.2% 20.0% Group 3 Group 2 Supplementary Figure 2. Decision-tree algorithm for extra-hepatic cancer. (B) Patients with chronic hepatitis B and chronic hepatitis C were excluded from the analysis subjects. The subjects were classified according to the indicated cut-off value for each variable. The pie graphs indicate the proportion of patients with no hepatocellular carcinoma (white) and patients with hepatocellular carcinoma (black) in each group.