Analysis of EpoR Expression in CD117+ and CD117- Cells from Adult Bone Marrow and Fetal Liver
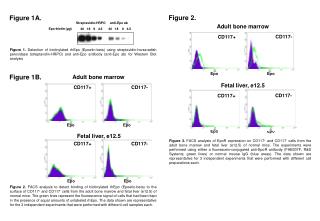
This study explores the expression of erythropoietin receptors (EpoR) on CD117+ and CD117- cells from adult bone marrow and fetal liver (embryonic day 12.5). We utilized Western Blot analysis to detect biotinylated rhEpo (Epoetin-beta) using streptavidin-HRPO and anti-Epo antibodies. Furthermore, FACS analysis was performed to evaluate the binding of rhEpo to these cells, providing insights through fluorescence signals. The results are representative of three independent experiments, highlighting the differential expression of EpoR in various cell populations.

Analysis of EpoR Expression in CD117+ and CD117- Cells from Adult Bone Marrow and Fetal Liver
E N D
Presentation Transcript
Figure 2. Figure 1A. anti-Epo ab Streptavidin-HRPO Adult bone marrow Epo-biotin (µg) 36 18 9 4.5 36 18 9 4.5 CD117- CD117+ Figure 1. Detection of biotinylated rhEpo (Epoetin-beta) using streptavidin-horseradish peroxidase (streptavidin-HRPO) and anti-Epo antibody (anti-Epo ab) for Western Blot analysis Epo Epo Figure 1B. Adult bone marrow Fetal liver, e12.5 CD117- CD117+ CD117- CD117+ Epo Epo Epo Epo Fetal liver, e12.5 Figure 3. FACS analysis of EpoR expression on CD117+ and CD117- cells from the adult bone marrow and fetal liver (e12.5) of normal mice. The experiments were performed using either a fluorescein-conjugated anti-EpoR antibody (FAB307F, R&D Systems; green lines) or normal mouse IgG (blue areas). The data shown are representative for 3 independent experiments that were performed with different cell preparations each. CD117- CD117+ Epo Epo Figure 2. FACS analysis to detect binding of biotinylated rhEpo (Epoetin-beta) to the surface of CD117+ and CD117- cells from the adult bone marrow and fetal liver (e12.5) of normal mice. The green lines represent the fluorescence signal of cells that had been kept in the presence of equal amounts of unlabeled rhEpo. The data shown are representative for the 3 independent experiments that were performed with different cell samples each.