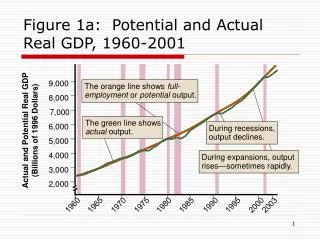
Hepatitis B Treatment Response Patterns Over Time
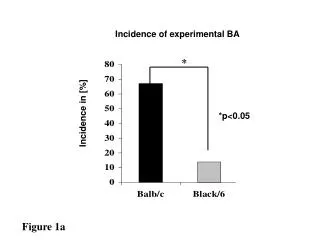
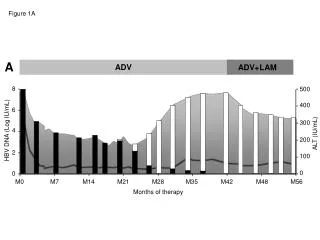
This study analyzes the response to HBV treatment combining ADV and LAM over 48 months. Changes in HBV DNA levels and ALT activity are monitored at specified intervals to assess treatment efficacy and outcomes.

Hepatitis B Treatment Response Patterns Over Time
E N D
Presentation Transcript
A ADV ADV+LAM 8 500 400 6 300 HBV DNA (Log IU/mL) ALT (IU/mL) 4 200 2 100 0 0 M0 M7 M14 M21 M28 M35 M42 M48 M56 Months of therapy Figure 1A
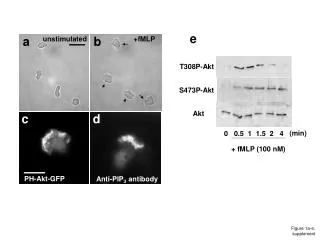
Figure 1B B ADV ADV+LAM 10 1000 8 800 600 6 HBV DNA (Log IU/mL) ALT (IU/mL) 4 400 2 200 0 0 M0 M5 M10 M15 M20 M25 M30 M35 M40 M45 Months of therapy
C ADV 500 10 400 8 300 6 ALT (IU/mL) HBV DNA (Log IU/mL) 200 4 2 100 0 0 M0 M5 M10 M15 M20 M25 M30 M35 M40 M45 Months of therapy Figure 1C
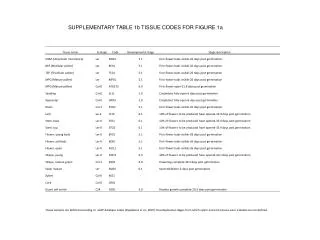
D ADV 8 500 400 6 300 ALT (IU/mL) HBV DNA (Log IU/mL) 4 200 2 100 0 0 M0 M5 M10 M15 M20 M25 Months of therapy Figure 1D
E ADV+ LAM ADV ADV 500 8 400 6 300 HBV DNA (Log IU/mL ) ALT (IU/mL) 4 200 2 100 0 0 M0 M7 M14 M21 M28 M35 M42 Months of therapy Figure 1E
Figure 1F F ADV 8 300 6 200 ALT (IU/mL) HBV DNA (Log IU/mL) 4 100 2 0 0 M0 M10 M20 M30 M40 M50 Months of therapy
Figure 1G G ADV ADV ADV+LAM 1000 10 800 8 600 6 HBV DNA (Log IU/mL) ALT (IU/mL) 4 400 200 2 0 0 M0 M7 M14 M21 M28 M35 M42 M48 Months of therapy