Supplementary Figure 1A
Supplementary Figure 1A. Supplementary Figure 1B. PCLB1. HNF4A. WNT5A. VANGL1.


Supplementary Figure 1A
E N D
Presentation Transcript
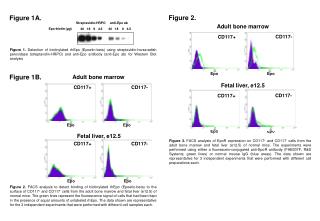
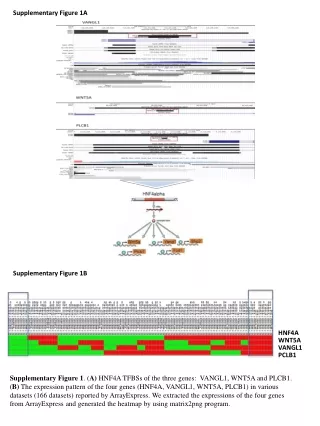
Supplementary Figure 1A Supplementary Figure 1B PCLB1 HNF4A WNT5A VANGL1 Supplementary Figure 1. (A)HNF4A TFBSs of the three genes: VANGL1, WNT5A and PLCB1. (B) The expression pattern of the four genes (HNF4A, VANGL1, WNT5A, PLCB1) in various datasets (166 datasets) reported by ArrayExpress. We extracted the expressions of the four genes from ArrayExpress and generated the heatmap by using matrix2png program.
Supplementary Figure 2 Supplementary Figure 2. Example of the selection step of PATHOME. (A) Assumed subpathway toy that consists of 6 nodes and 5 edges. According to our index notation, p is 6 and i 1 to 5. Blunt-ended edge indicates inhibition and arrow-headed edge activation. In each group, nominal values of rki,i+1s were given by the table for the following explanation. (B) Following our notation, edges (ei,i+1s) were coded by -1, +1, -1, +1, and +1, from left to right, respectively. Subsequently, we showed how the curly bracket (say yk; k: group index) of the lk (the length of the segment) equation was calculated. The graphs of yk (k=1,2) versus m (1 to 5) indicate that arguments minimizing yks are 4 and 5 for group 1 and group 2, respectively. Thus, l1 and l2 are 5 and 6, respectively. l1 and l2 are considered in the test step of PATHOME.
Supplementary Figure 3 Supplementary Figure 3. Measurement of expression level by RT-PCR, WNT5A, VANGL1, FZD1 and PLCB1, in the gastric cancer cell line panels.
Supplementary Table 1. The 27 KEGG pathways containing the significant 113,810 subpathways in GSE13861 (FDR < 0.05). For the comparison, all the significant subpathways were assigned to their pathways.
Supplementary Table 2. The significant KEGG pathways reported by DAVID in GSE13861. The input genes in DAVID were selected with fold-change 2. The significance cutoff was Benjamini false discovery rate (column Benjamini) < 0.3. The column description refers to the DAVID webpage (david.abcc.ncifcrf.gov).
Supplementary Table 3. The significant KEGG pathways reported by GSEA in GSE13861. The significance was set to FDR q-value < 0.3. The column description refers to GSEA webpage (www.broadinstitute.org/gsea/).
Supplementary Table 4. The 15 KEGG pathways containing the significant 126,095 subpathways in GSE15081. The significance of a supathway was set to FDR-q value < 0.05. For the comparison, all the significant subpathways were assigned to their pathways.
Supplementary Table 5. The significant KEGG pathways reported by DAVID in GSE15081. The input genes in DAVID were selected with fold-change 1.25. The significance cutoff was Benjamini false discovery rate (column Benjamini) < 0.3. The column description refers to the DAVID webpage (david.abcc.ncifcrf.gov/).
Supplementary Table 6. The significant KEGG pathways reported by GSEA in GSE15081. The significance was set to FDR q-value < 0.3. The column description refers to GSEA webpage (www.broadinstitute.org/gsea/).
Supplementary Table 7. The 62 genes belonging to the combined significant subpathways in the discovery stage.
Supplementary Table 8. The expression concordance among the four datasets (GSE13861, GSE36968, GSE15081, GSE27342) in terms of the 62 genes of the combined subpathways in the discovery stage. The similarity was measured by Fisher’s exact test. 1Up/Down regulated genes in GC cells over normal-appearing cells. 2Up/Down regulated genes in GC peritoneal relapse over non-relapse.