Functional Validation of PGN Triple Fusion and PGN-Containing Trap Vectors in MLP-29 Cells
10 likes | 143 Vues
This study explores the functional validation of PGN triple fusion constructs and the design of PGN-containing trap vectors. Using flow cytometry, we analyzed average fluorescence in MLP-29 cells stably transfected with GFP, GFNR, and PGN. We conducted FACS analysis to assess the distribution of green fluorescence across four cell populations, including untransduced cells and those selected with varying doses of puromycin, highlighting the efficacy of drug selection methods. Additionally, we provide a schematic representation of the PGN-vector components, including splice acceptors and viral encapisdation signals.

Functional Validation of PGN Triple Fusion and PGN-Containing Trap Vectors in MLP-29 Cells
E N D
Presentation Transcript
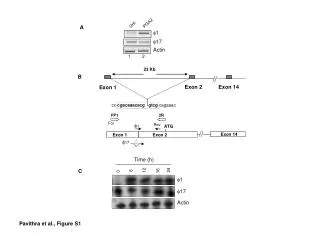
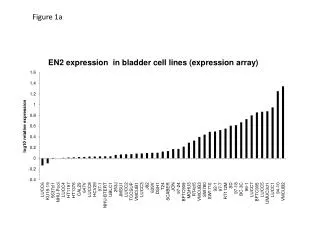
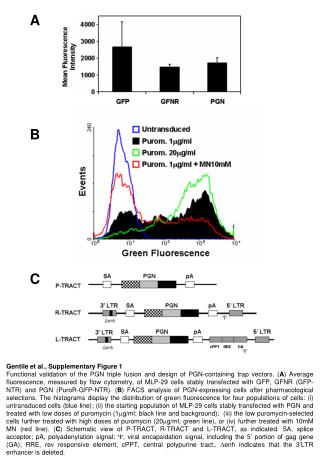
A B Gentile et al., Figure 1A C Gentile et al., Supplementary Figure 1 Functional validation of the PGN triple fusion and design of PGN-containing trap vectors. (A) Average fluorescence, measured by flow cytometry, of MLP-29 cells stably transfected with GFP, GFNR (GFP-NTR) and PGN (PuroR-GFP-NTR). (B) FACS analysis of PGN-expressing cells after pharmacological selections. The histograms display the distribution of green fluorescence for four populations of cells: (i) untransduced cells (blue line); (ii) the starting population of MLP-29 cells stably transfected with PGN and treated with low doses of puromycin (1g/ml; black line and background); (iii) the low puromycin-selected cells further treated with high doses of puromycin (20g/ml; green line), or (iv) further treated with 10mM MN (red line). (C) Schematic view of P-TRACT, R-TRACT and L-TRACT, as indicated. SA, splice acceptor; pA, polyadenylation signal; , viral encapsidation signal, including the 5’ portion of gag gene (GA); RRE, rev responsive element, cPPT, central polypurine tract;. enh indicates that the 3’LTR enhancer is deleted.