Download
1 / 8
100 likes | 275 Vues
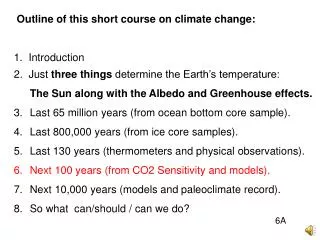
Outline of this short course on climate change: 1. Introduction 2. Just three things determine the Earth’s temperature: The Sun along with the Albedo and Greenhouse effects. Last 65 million years (from ocean bottom core sample). Last 800,000 years (from ice core samples).

E N D
Outline of this short course on climate change: • 1. Introduction • 2. Just three things determine the Earth’s temperature: The Sun along with the Albedo and Greenhouse effects. • Last 65 million years (from ocean bottom core sample). • Last 800,000 years (from ice core samples). • Last 130 years (thermometers and physical observations). • Next 100 years (from CO2 Sensitivity and models). • Next 10,000 years (models and paleoclimate record). • So what can/should / can we do? 6A
The CO2 “overload” due to the combustion of fossil fuels has a very long lifetime, on the order of a few millennia. Therefore, every day we set a new higher level of atmospheric CO2 that will last essentially “forever” on the time scale of western civilization. Note: 450 ppm CO2 used to be considered a laudable goal. It no longer is. 6B
“business as usual” models And keeps on climbing in the 22nd Century. 6C "Image created by Robert A. Rohde / Global Warming Art"
Note that continental surfaces warm up about twice as much as the oceans. "Image created by Robert A. Rohde / Global Warming Art" 6D Note that the Southern Hemisphere warmed less due to its greater oceanic surface.
Hoover Dam, 3-05-08 Notice the white band showing level from 10 years ago. 1111 feet in ‘08; was 1215 feet in ‘98 6E
Note that the frequency of extreme hot-weather events will increase much more than the increase in average temperature. 6F
6G "Image created by Robert A. Rohde / Global Warming Art"