
SlideServe
Menu
Préférences
© SlideServe · v2026

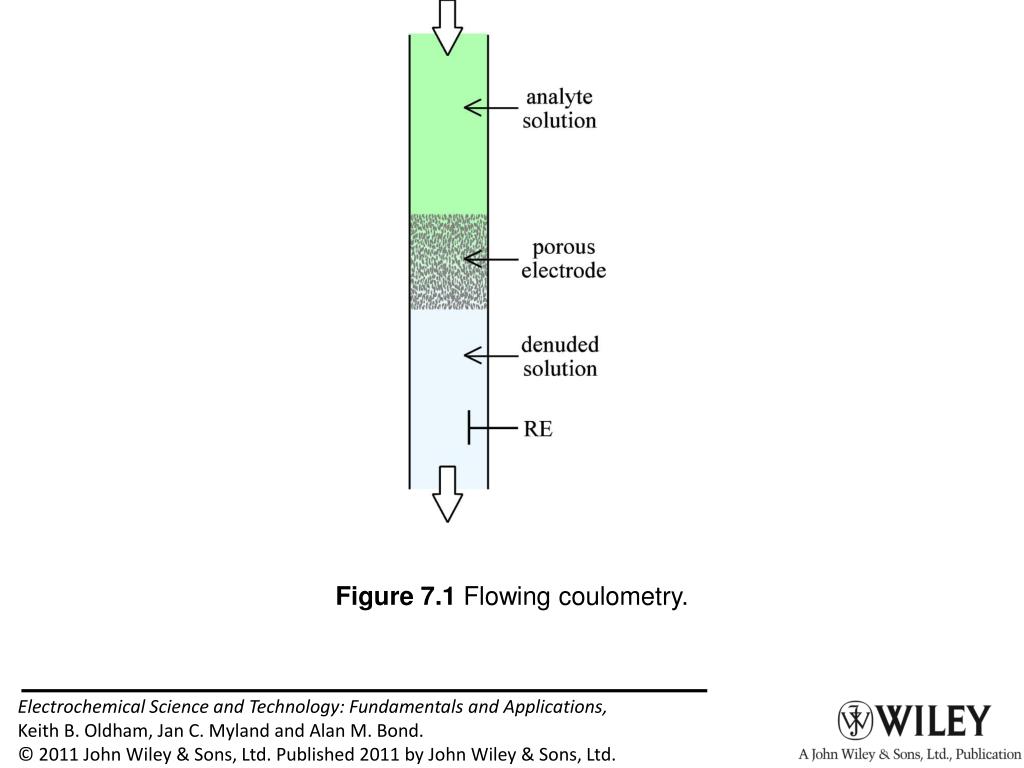
Figure 7.1 Flowing coulometry.

cinnamon-mitchell avatar
6 diapositives · 379 Views · Nov 18, 2014
Figure 7.1 Flowing coulometry. - slide 1
01 / 6Figure 7.1 Flowing coulometry.
1 / 17

Télécharger la présentation

Figure 7.1 Flowing coulometry.
Une image / un lien ci-dessous est fourni (tel quel) pour télécharger la présentation

Politique de téléchargement : le contenu du site vous est fourni TEL QUEL pour votre information et votre usage personnel ; il ne peut être vendu, concédé sous licence ni partagé sur d’autres sites sans l’accord de son auteur.Le contenu vous est fourni TEL QUEL, pour votre information et votre usage personnel uniquement. Téléchargez la présentation en cliquant sur ce lien. Lors du téléchargement, si vous ne parvenez pas à télécharger une présentation, l’éditeur a peut-être supprimé le fichier de son serveur.Pendant le téléchargement, si vous ne parvenez pas à obtenir une présentation, le fichier a peut-être été supprimé par l’éditeur.

F I N

Plus de contenu associé

Transcription de la présentation
  1. Figure 7.1 Flowing coulometry.

  2. Figure 7.2 An example of the current-voltage curve resulting from a totally polarized working electrode, in this case a gold electrode in an aqueous potassium nitrate solution. The solvent-oxidation and solvent-reduction reactions occurring at extreme potentials are shown. Between them is the “window” within which other electrode reactions may be investigated.

  3. Figure 7.3 The reductive and oxidative rate constants depend exponentially on electrode potential and share a common value at the formal potential. The reductive transfer coefficients α = 0.35 and α = 0.50were chosen for the red and green curves respectively

  4. Figure 7.4 The oxidative current density and the reductive current density sum to give the measured net current density. At the null potential En the two partial current densities are identical in magnitude but opposite in sign.

  5. Figure 7.5 The Tafel plot. The straight line portions occur where i ≈ ird and where i ≈ iox. The graph is curved close to the null potential En, where neither approximation holds. The construction lines show how the null potential and the composite exchange current density in may be measured.

  6. Figure 7.6 A chart illustrating how the determination of a rate law is used to rule out certain putative mechanisms. Here Mechanism I is unacceptable, but II and III remain possibilities.