Analysis of MeGAs in Wild-Type Siliques Using GC-MS with Internal Standards
This study presents the analysis of MeGAs (2H2-MeGA1 and 2H2-MeGA20) in wild-type siliques through GC-selected ion monitoring. TMSi-derivatives of samples were analyzed using GC-MS. We present total ion chromatograms (TIC) of selected ions and the monitoring of internal standards alongside endogenous MeGA levels. Notably, endogenous MeGA20 was undetectable, and the identity of a minor peak at m/z 506 corresponding to MeGA1 was inconclusive due to low abundance. Mass spectrum analysis supports the identity of internal standards.

Analysis of MeGAs in Wild-Type Siliques Using GC-MS with Internal Standards
E N D
Presentation Transcript
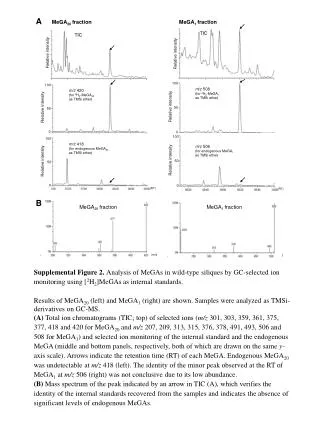
209 A MeGA20 fraction MeGA1 fraction TIC TIC Relative intensity Relative intensity 100 100 m/z 508 (for 2H2-MeGA1 as TMSi ether) m/z 420 (for 2H2-MeGA20 as TMSi ether) Relative intensity Relative intensity 50 50 0 0 100 100 m/z 418 (for endogenous MeGA20 as TMSi ether) m/z 506 (for endogenous MeGA1 as TMSi ether) Relative intensity Relative intensity 50 50 0 0 (RT) (RT) B MeGA20 fraction MeGA1 fraction Relative intensity Relative intensity (m/z) (m/z) Supplemental Figure 2. Analysis of MeGAs in wild-type siliques by GC-selected ion monitoring using [2H2]MeGAs as internal standards. Results of MeGA20 (left) and MeGA1 (right) are shown. Samples were analyzed as TMSi-derivatives on GC-MS. (A) Total ion chromatograms (TIC; top) of selected ions (m/z 301, 303, 359, 361, 375, 377, 418 and 420 for MeGA20 and m/z 207, 209, 313, 315, 376, 378, 491, 493, 506 and 508 for MeGA1) and selected ion monitoring of the internal standard and the endogenous MeGA (middle and bottom panels, respectively, both of which are drawn on the same y-axis scale). Arrows indicate the retention time (RT) of each MeGA. Endogenous MeGA20 was undetectable at m/z 418 (left). The identity of the minor peak observed at the RT of MeGA1 at m/z 506 (right) was not conclusive due to its low abundance. (B) Mass spectrum of the peak indicated by an arrow in TIC (A), which verifies the identity of the internal standards recovered from the samples and indicates the absence of significant levels of endogenous MeGAs.