Download
1 / 43
430 likes | 501 Vues
Explore the dynamics of quasars as physics laboratories in the early universe via absorption lines, gas evolution, and ionization feedback. Discover how simulations, structure growth, and star formation play key roles in understanding galaxy evolution. Study Mg II profiles and their connection to astrophysical sites through kinematic models and a new taxonomy of absorbers.

E N D
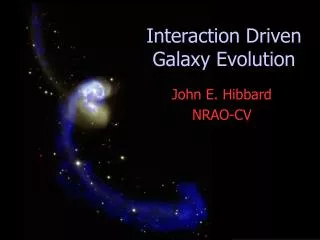
Missing Photons that Count: Galaxy Evolution via Absorbing Gas (and a little bit of fundamental physics to boot) Chris Churchill (Penn State)
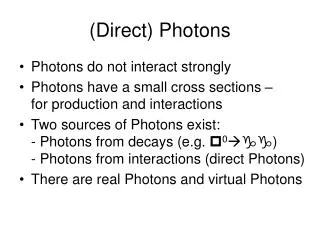
Quasars: physics laboratories in the early universe quasar To Earth Lya Lyb SiII CIV SiII CII SiIV Lyman limit Lyaem Lybem NVem Lya forest CIVem SiIVem
QSO Absorption Lines: Anatonomy of a Spectrum Quasar Q1759+75 H I emission H I absorption Metal absorption
QSO Absorption Lines: Anatonomy of a Spectrum C IV doublet
QSO Absorption Lines: Anatonomy of a Spectrum C IV 1548Å C IV 1550Å
QSO Absorption Lines: Anatonomy of a Simulation (courtesy M. Steinmetz) Efforts have been made to include ionization feedback, both in terms of spectral energy distributions, photon transport, and mechanical stirring of the gas…
QSO Absorption Lines: Anatonomy of a Simulation (courtesy M. Steinmetz) Technology and innovation is quickly outpacing observational data…
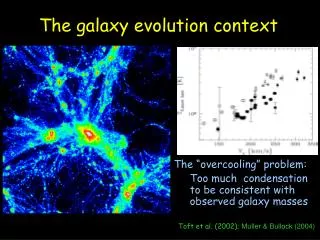
Great Insights are gained from simulations of structure growth, but these simulations are starved for hard data to constrain the physics… (courtesy M. Haehnelt) Note structure growth is rapid at for z>5 (a short cosmological time frame), and then evolution is slower, especially from z<1 (majority of time)…
The Power of Simply Counting Lines The redshift path density, dN/dz, places constraints on simulations of structure growth as a function of redshift… (Dave’ etal 1999)
The Power of Simply Counting Lines (Weymann’ etal 1999) (Dave’ etal 1999)
The Power of Simply Counting Lines Mg II shows no evolution (co-moving), butnothing in known above z=2.2 Lyman Limit systems (LLS) show no evolution, measured from continuum “break” at 916 A in the rest frame, N(HI)>1017.3 cm-2 C IV systems evolve rapidly! They increase with cosmic time until z=1.5 and then show no evolution Structure, Ionization, or Chemical Evolution? • Evolution measures product of: • number • size • ionization fraction Is this an increase in number, in ionization level, or in the chemical abundance of carbon? We need low ionization data. Mg II.
Motivations and Astrophysical Context Mg II arises in environments ranging over five decades of N(H I) • Damped Lyman-a Absorbers (DLAs): N(HI) > 2x1020 cm-2 eg. Biosse’ etal (1998); Rao & Turnshek (2000); Churchill etal (2000b) • Lyman Limit Systems (LLSs): N(HI) > 2x1017 cm-2 eg. Steidel & Sargent (1992); Churchill etal (2000a) • sub-LLSs: (low redshift forest!) N(HI) < 6x1016 cm-2 eg. Churchill & Le Brun (1998); Churchill etal (1999); Rigby etal (2001) Mg II a-process ion – Type II SNe – enrichment from first stars (<1 Myr) Fe II iron-group ion – Type Ia SNe – late stellar evolution (>few Gyr) Mg II selection probes a wide range of astrophysical sites where star formation has enriched gas; these sites can be traced from redshift 0 to 5
Mg II 2796 Absorption Profiles from HIRES/Keck (Cwc & Vogt 2001)
Mg II 2796 Absorption Profiles from HIRES/Keck Each Mg II system has several Fe II transitions and Mg I (neutral) The clouds are modeled using Voigt profile decomposition… Obtain number of clouds, temperatures, column densities, ionization conditions (from modeling)…
Mg II System in Full Glory (Cwc & Charlton 1999)
Mg II 2796 Absorption Profiles from HIRES/Keck (Cwc 2001) Galaxy redshifts can be matched to the absorbers…
Simple Kinematic Models of Absorbing Gas from Galaxies (Charlton & Cwc 1998) Absorption kinematics is symmetric about the galaxy’s systemic velocity Absorption kinematics is offset in the direction of stellar rotation compared to the galaxy’s systemic velocity Halo/infall + Rotating/disk produces both signatures in single profile
Q0827+243 Q1038+064 Q1148+387 (Steidel etal 2002)
A New Taxonomy of Absorbers: How do they evolve? A multivariate (multi-dimensional) analysis, including cluster-tree analysis, yielded 5 classes of Mg II selected absorbers based upon the Lya, Fe II, Mg II, C IV strengths and Mg II kinematics… Tree Diagram (Cwc etal 2000)
A New Taxonomy of Absorbers: How do they evolve? It is driven by kinematics, as seen on the C IV – Mg II plane! What can we learn about the chemical and ionization conditions? What can we learn about environment and evolution? (Cwc etal 2000)
Mg II Kinematics and Higher Ionization: Multiphase Ionization The C IV, N V, and O VI arise in a separate ionization ionization phase- models of Mg II clouds cannot produce higher ionization absorption… WIYN image of Q1206 field shows four galaxies… Group environment absorbers, or galaxy hosted absorbers? STIS/HST (Cwc & Charlton 1999; Ding etal 2003)
Kinematics: Stellar, Mg II 2796, and C IV 1548, 1551 Mg II traces stellar kinematics yet is difficult to explain as extended disk rotation (at 72 kpc impact parameter!). C IV traces Mg II kinematics but has strongest component at galaxy’s systemic velocity, as highlighted in l1551. What physical entity is giving rise to this C IV component? (Cwc 2003; Cwc etal, in prep)
Population of Weak Systems: Where do they arise? • Their equivalent width distribution follows a power law down to 0.02 A • Arise in optically thin H I (Lya clouds) • 25%-100% of all Lya clouds with column densities 1015.5<N(HI)<1016.5 cm-2 • Constrained to not have supersolar metallicity, almost all have z>0.1 solar • Many are iron rich, suggesting later stages of star formation • 90% cannot be associated with galaxies (within 70 kpc) (Cwc etal 1999; Rigby etal 2002)
LBT: A Quasar Spectroscopy-Galaxy Evolution Machine PEPSI ……………………………….. High resolution spectra of QSOs Wide Field Prime Focus Cam ……….. Images of QSO fields to find galaxy candidates Multi-Object Double spectrograph ….. Spectra to confirm galaxy candidates, kinematics Lucifer ……………………………….. Near infrared spectra of QSOs (high z!)
Equivalent Width Distribution Using HIRES/Keck, we discovered that the EW distribution followed a power law, with no observable cut off down to W=0.02 A. - these are high metallicity “forest” clouds. 5 papers over 10 years predicted that none of these “weak” systems existed! They outnumber galaxies by 1:106. Differential Number Density Distribution As the lower EW cutoff of the sample, Wmin, is increased, the number of systems per unit redshift decreases… (As Wmin increases, the mean redshift increases – ) differential redshift evolution Redshift Path Density Comoving redshift path density is consistent with no structure/ionization evolution for Wmin=0.02 A (red) and Wmin=0.3 A (blue). dN/dz ~ ns(1+z)g .
Evolution of Strongest Systems Scenario of kinematic evolution of gas… As Wmin increased – evolution is stronger R E D S H I F T dN/dz = N0(1+z)g What is the nature of the evolution??? Is it related to high velocity clouds, presence of supperbubbles, or superwinds???
Present Day Coverage and Astrophysical Context The epochs of greatest evolution are un-probed… (Based upon Pei etal 1999)
Constraints on Global Galaxy Evolution Models No coverage for Mg II for z>2.2 No high resolution coverage for Mg II for z>1.4 W(stars) W(gas) W(IGM metals) Mg II provides metalicity for high-z forest in lower ionization gas- heretofore un-probed W(baryons) W(gas flow) (Pei etal 1999)
Unleashing LUCIFER’s Powers (R=5000) J=19 z=4.2 Quasar: R=10,000 (0.1 arcsec/pix, t=2.5hrs) Simulated Mg II systems at z=3.13 and z=3.71 in the J-band
Unleashing LUCIFER’s Powers (R=10,000) (Kobayashi etal 2002) These observations are challenging; but all the far UV transitions can be observed in the optical! So, wholesale analysis can be performed…
Constraints on Correlated Supernovae: Superbubbles • Local Example of Superbubble! • These are generated by 50-1000 SNe exploding in a time frame of 105 yr; • Expansion rate depends upon ratio of SNe power to ISM density (Bond etal 2001) As bubble expands, nears side is blue shifted and far side is redshifted to give uniform velocity splittings; ~4 superbubbles at z=0.7446!
Constraints on Correlated Supernovae: Superbubbles (Rauch etal 2002) Constrained quantities: ratio of L38 = energy released by SNe in units of 1038 erg/s n0 = density of ISM in units of atoms cm-3
Constraints on Correlated Supernovae: Superbubbles (Bond etal 2002) (Rauch etal 2003)
Constraints on Nuclear Activity: Superwinds Starburst Galaxies are strong Ha emitters: by associating Ha emitters with superwinds we can constrain the evolution of galactic superwinds (Bond et al.) (coutesy D. Strickland) The profiles (right) are similar to those observed for local starburst/superwind galaxies (Bond etal 2002)
Build the Database and the Simulations will Follow Ultimately, the simulations need to be driven by the data… as we have seen the great successes in this arena for the Lya forest to z=5, and are seeing the new successes for metal enriched diffuse objects to z=5…. (courtesy M. Haehnelt) (courtesy M. Steinmetz) We will begin to see the successes of galaxy evolution in more detail, including structure evolution, kinematics, metallicity, and ionization. The data are lacking. Wholesale inventory of Mg II absorbers is the best approach.
Evidence For Cosmological Evolution of the Fine Structure Constant? a = e2/hc Da = (az-a0)/a0
Procedure 1. Compare heavy (Z~30) and light (Z<10) atoms, OR 2. Compare s p and d p transitions in heavy atoms. Shifts can be of opposite sign. Illustrative formula: Ez=0 is the laboratory frequency. 2nd term is non-zero only if a has changed. q is derived from relativistic many-body calculations. Relativistic shift of the central line in the multiplet K is the spin-orbit splitting parameter. Numerical examples: Z=26 (s p) FeII 2383A: w0 = 38458.987(2) + 1449x Z=12 (s p) MgII 2796A: w0 = 35669.298(2) + 120x Z=24 (d p) CrII 2066A: w0 = 48398.666(2) - 1267x where x = (az/a0)2 - 1 MgII “anchor”
Da/a= -5×10⁻⁵ Low-z High-z