Download

1 / 48
480 likes | 635 Vues
R.12-03-014: Energy Division Workshop – Operating Flexibility Modeling. Noushin Ketabi & Nathaniel Skinner Senior Analysts, Generation & Transmission Planning California Public Utilities Commission April 24, 2012. WebEx

E N D
R.12-03-014: Energy Division Workshop – Operating Flexibility Modeling Noushin Ketabi & Nathaniel Skinner Senior Analysts, Generation & Transmission Planning California Public Utilities Commission April 24, 2012
WebEx Meeting Number: 749 519 939 Meeting Password: ltpphttps://van.webex.com/van/j.php?ED=202738302&UID=491292852&PW=NZWM0MTAzYTBk&RT=MiM0 Remote Access Call in #: Passcode: 866-812-8481 9058288# Note: *6 to mute/unmute Upon entry to the call, please place yourself on mute, and remain on mute unless you are asking a question
Workshop Purpose • Review current operating flexibility study methodology • Review preliminary results on the 2012 LTPP base case • Next steps for studies
2012 LTPP Track 2 – Operational Flexibility Study CPUC LTPP Track 2 Workshop Shucheng Liu, Ph.D. Principal, Market Development April 24, 2013
About 2012 Long-Term Procurement Plan (LTPP) Track 2 study • CPUC requested the ISO conduct an operational flexibility modeling study using the Standardized Planning Assumptions and Scenarios as determined in the CPUC Dec 24, 2012 decision (12-03-014). • ISO proposed to conduct the operational flexibility study using a Plexos production cost simulation model. • ISO plans to study: 1) Base scenario, 2) Replicating TPP scenario, 3) High DG + High DSM scenario, and 4) the Early SONGS Retirement sensitivity case.
Agenda • Model assumptions and data sources • Preliminary results of Base Scenario • Proposed study schedules • Response to stakeholder comments on study plan
The Plexos production cost simulation model uses data from several sources. CPUC RPS Calculator v3 2010 LTPPStudy Group 5Assumptions CPUC Scenario Tool v4 2012 LTPP Plexos Model TEPPC 2022 PC1 Case & WECC 2012 LRS Report CEC 2012 IPER & 2013 IPER Preliminary ISO Operation Data ISO Master Generating Capability List Additional CPUC and CEC inputs
Assumptions from 2010 LTPP Study Group 5 analysis – reserve requirements 2010 LTPPStudy Group 5Assumptions • WECC reserve requirements • Spinning = 3% of load • Non-spinning = 3% of load • Regulation = 1% of load (outside CA) • Load following up and down were based on the ISO 2012 Energy Imbalance Market study assumption (outside CA) • Regulation and load following requirements outside CA will be updated according to TEPPC 2022 PC1 Case
Assumptions from 2010 LTPP Study Group 5 analysis – CO2 cost modeling 2010 LTPPStudy Group 5Assumptions CEC new forecast • In CA as a generation cost adder: CO2 Cost Adder = $24.13/MTon • In WECC, except CA and BPA, as a CA import hurdle rate (an adder to wheeling charge): Hurdle Rate = 0.435 MTons/MWh * 24.13 $/MTon = $10.50 /MWh • BPA to CA hurdle rate: Hurdle Rate = 20% x $10.50 = $2.10/MWh • Refer to ARB rules http://www.arb.ca.gov/regact/2010/ghg2010/ghgisoratta.pdf
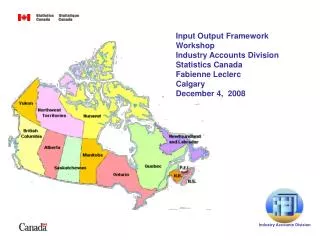
Load forecasts and load shapes are drawn from multiple data sources. TEPPC 2022 PC1 Case & WECC 2012 LRS Report Outside CALoad Forecast Outside CA Load Profiles WECC All Load Shapes ISO 2009-2011 Pump Load Profiles CA Load Profiles CEC 2012 IPER CA Load Forecast & Incremental Adjustment CPUC Scenario Tool v4
CA load forecasts are adjusted by incremental demand-side resources and pump load. Coincident Peak CAISO=50,156 MW CA=60,612 MW
Generation resource operating characteristics are primarily taken from TEPPC 2022 PC1 Case. Outside CA Resources & Characteristics TEPPC 2022 PC1 Case & WECC 2012 LRS Report CA Resources & Characteristics ISO Master Generating Capability List CA Demand Response CPUC Scenario Tool v4
CEC and CPUC recommended assumptions for Southern California local capacity resources. Additional CPUC and CEC Inputs • CPUC Track 1 decisions • SDG&E 343 MW • SCE 1,400 – 1,800 MW • <1,200 MW gas fired resources • >150 MW preferred resources • <600 MW preferred resources or storage • >50 MW storage • CEC and CPUC recommendation • SDG&E - 343 MW GT • SCE - 900 MW CCGT, 100 MW GT, 50 MW storage
CA renewable generation portfolios follow the CPUC scenario definitions. Outside CA Renewable Generation Profiles TEPPC 2022 PC1 Case & WECC 2012 LRS Report CA Renewable Generation Profiles CPUC Renewable Generation Shapes CA Resources portfolios CPUC RSP Calculator v3
CA renewable portfolio for Base Scenario has a mix of various types of renewable resources.
CA renewable portfolio for Base Scenario has some additional assumptions.
CEC provided staff forecast of natural gas prices. Additional CPUC and CEC Inputs • Comparison of natural gas price forecasts for 2012 and 2010 LTPP studies
CEC also provided CO2 price forecast. CEC 2012 IPER & 2013 IPER Preliminary • CEC 2013 IPER preliminary forecast • $24.13/Mton (or $21.89/Ston) in 2012 dollars vs. • $36.30/Ston in 2010 dollars for 2010 LTPP Study
Transmission path ratings and wheeling chargesare primarily from TEPPC 2022 PC1 Case. TEPPC 2022 PC1 Case & WECC2012 LRS Report • WECC path ratings and wheeling charges • TEPPC 2022 PC1 Case • Southern California Import Transmission (SCIT) and CA simultaneous import limit • SCIT calculation tool • CA import hurdle rate • $10.50 /MWh adder to wheeling charge of import into CA (except import from BPA) • $2.10/MWh adder to wheeling charge of import from BPA into CA
Step 1 regulation and load following requirement calculation uses t-30 minute forecast errors.
Using t-30 min forecast errors resulted in lower load-following requirements.
Over-generation modeling method changed to capture negative energy prices. • Model regulation-down and load following-down requirements as hard constraint (cannot be violated) • Set Dump-Power price to -$300/MWh • In case of over-generation • High positive load following-down price • -$300/MWh energy price
Additional updates will be implemented. • Ramp rates calculated based on the Master File data • Forced and planned outage rates based on the ISO 2006-2010 operation data or NERC GASDS data • Reserve sharing across Balance Authority Areas • SCIT and CA import limits based on improved SCIT tool • More detail modeling of solar thermal with storage
Preliminary results of Base Scenario do not show any shortage or over-generation. • Conducted Need Run simulations for March and July • Found no upward shortage or over-generation • Utilizes all import capability and almost all available capacity* on peak-load day • Exports energy for some hours in March * Available Capacity = Rated Capacity – Planned Outage – Forced Outage Rated Capacity of renewable resource = generation profile value
ISO plans to complete simulations by: • May 2013 • Full-year deterministic simulation of Base Scenario • July 2013 • Deterministic simulation of other two scenarios and early SONGS retirement sensitivity case • August 2013 • Stochastic simulation of one or two scenarios • November 2013 • Deterministic simulation of 2018 case
ISO investigated changing Step 1 regulation and load following requirement calculation to a 15-min interval. • Stakeholder comments • May reduce a conservative bias • Potentially underestimates flexible capacity requirement • Does not match with production cost simulation interval • ISO Response • Hourly interval aligns with operational practice • ISO plans to keep hourly interval in Step 1 calculation
ISO suggested using t-30 minute forecast errors in Step 1 calculation. • Stakeholder comments • It could be useful • It should go down to t-15 minutes • Forecast error should be calculated over the hour • ISO Response • ISO performs last load forecast before real-time unit commitment at t-30 minutes • t-30 minute forecast covers the next hour • ISO plans to use t-30 minute forecast errors in Step 1 calculation
ISO proposed to conduct full-year hourly deterministic production cost simulations. • Stakeholder comments • Is a good baseline simulation and can be easily replicated by other parties • Should be combined with stochastic simulations • May focus only on months with potential shortage or over-generation • ISO response • ISO will conduct full-year hourly deterministic simulations for the three scenarios and one sensitivity case requested by the CPUC
ISO suggested hourly stochastic simulations for selected months. • Stakeholder comments • May not be necessary • Better reflect the day-ahead unit commitment process and require less computing power • ISO response • ISO is evaluating the options to augment the deterministic results using stochastic simulations
ISO solicited input about conducting 5-min stochastic simulations without load following requirements. • Stakeholder comments • Support the approach • Need more information • Do not see much value in running a limited stochastic analysis using Plexos • Tie identified need to specific criteria, such as 1-in-10 • ISO response • ISO is evaluating the options to augment the deterministic results using stochastic simulations
ISO presented capacity weighted-average ramp rates calculated by technology and vintage. • Stakeholder comments • Classify resources on the basis of size or on the basis of particular technologies within a technology (such as LMS100, LM6000 etc.) • ISO response • ISO is refining the calculation based on available information
ISO calculated forced and planned outage rates based on operational data. • Stakeholder comments • Benchmark against an industry standard • Feed annual outage rate into the model and optimize it over months • ISO response • ISO is refining the calculation and will compare the rates with that from NERC GADS database • Model uses annual outage rates • ISO will assess method to optimize planned outage over months
Model has two methods to capture flexibility or capacity shortages in simulation. • Stakeholder comments • Use the perfectly flexible resource instead of generic GT units • Use finer tiered-cost structure with 100 MW generic GT units • ISO response • ISO will keep both tiered-cost structure and perfectly flexible resource methods • The cost tiers will be refined
Stakeholders suggest modeling reserve sharing. • Stakeholder comments • Consider what the ISO proposed in Transmission Planning Process for reserve sharing across Balance Authority Areas • ISO response • ISO will implement reserve sharing in the model
Thank you! Shucheng Liu, Ph.D. California ISO sliu@caiso.com
Thank you! For Additional Information: www.cpuc.ca.gov www.GoSolarCalifornia.ca.gov www.CalPhoneInfo.com