Effects of Ionizing Radiation on NECs and CECs: In Vitro Analysis of Gene Expression and Activity
This study investigates the effects of ionizing radiation (4 Gy) on normal epithelial cells (NECs) and cancerous epithelial cells (CECs) isolated from five patients. After exposure, cultures were subjected to various assays including RT-PCR to measure mRNA expression of MMP2 and plasminogen, zymography for MMP-2 and MMP-9 activities, and ELISA for angiostatin and IL-6 generation. Results were obtained from triplicate experiments for statistical reliability, providing insights into cellular response to radiation stress.

Effects of Ionizing Radiation on NECs and CECs: In Vitro Analysis of Gene Expression and Activity
E N D
Presentation Transcript
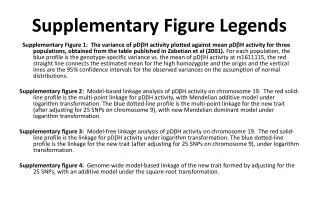
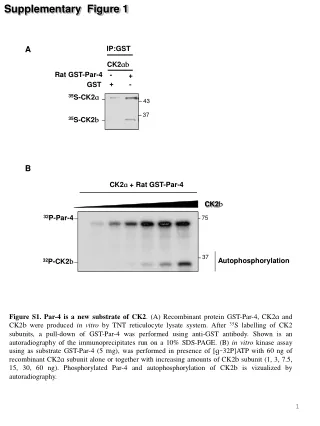
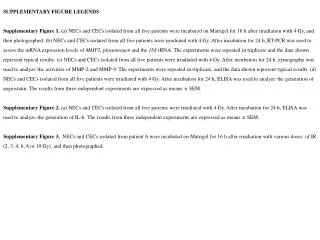
SUPPLEMENTARY FIGURE LEGENDS Supplementary Figure 1. (a) NECs and CECs isolated from all five patients were incubated on Matrigel for 16 h after irradiation with 4 Gy, and then photographed. (b) NECs and CECs isolated from all five patients were irradiated with 4 Gy. After incubation for 24 h, RT-PCR was used to assess the mRNA expression levels of MMP2, plasminogen and the 18S rRNA. The experiments were repeated in triplicate and the data shown represent typical results. (c) NECs and CECs isolated from all five patients were irradiated with 4 Gy. After incubation for 24 h, zymography was used to analyze the activities of MMP-2 and MMP-9. The experiments were repeated in triplicate, and the data shown represent typical results. (d) NECs and CECs isolated from all five patients were irradiated with 4 Gy. After incubation for 24 h, ELISA was used to analyze the generation of angiostatin. The results from three independent experiments are expressed as means ± SEM. Supplementary Figure 2. (a) NECs and CECs isolated from all five patients were irradiated with 4 Gy. After incubation for 24 h, ELISA was used to analyze the generation of IL-6. The results from three independent experiments are expressed as means ± SEM. Supplementary Figure 3. NECs and CECs isolated from patient A were incubated on Matrigel for 16 h after irradiation with various doses of IR (2, 3, 4, 6, 8 or 10 Gy), and then photographed.
Supplementary figure 1. Patient A Patient B Patient C (A) 4 Gy 4 Gy Cont Cont 4 Gy Cont NECs CECs Patient E Patient D 4 Gy Cont Cont 4 Gy NECs CECs
Supplementary figure 1. (B) - - - - - + + + + + MMP2 18S rRNA Zymography CECs NECs Patient A B C D E (C) (D) - - - - - Patient A B C D E + + + + + 4 Gy Plasminogen MMP2 18S rRNA MMP9 Generation of angiostatin - - - - - + + + + + 4 Gy NECs Patient A B C D E 4 Gy Patient A B C D E A B C D E NECs CECs
Supplementary figure 2. Generation of IL-6 Patient A B C D E A B C D E NECs CECs
Supplementary figure 3. Control 2 Gy 3 Gy 4 Gy 6 Gy 8 Gy 10 Gy NECs CECs