Legends for supplementary figures
This study evaluates the suppression of SRp20 expression via doxycycline (Dox)-induced siRNA in SKOV3 and IGROV1 ovarian cancer sublines. Results from Western blotting indicate effective knockdown of SRp20 with Dox treatment. The effect on cell proliferation was analyzed through growth curves, while Hoechst 33342 staining illustrated apoptotic nuclei, with quantification of apoptotic cells corroborating the findings. Additionally, tables provide statistical analyses on the distribution and expression patterns of PTB or SRp20 across tumor stages and histologic subtypes.

Legends for supplementary figures
E N D
Presentation Transcript
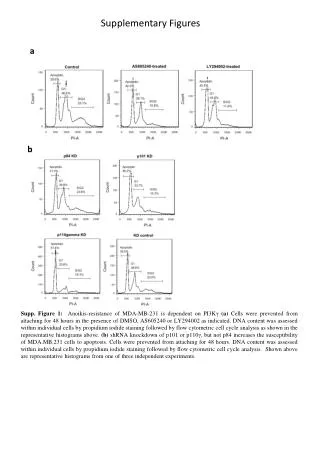
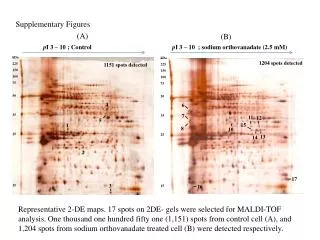
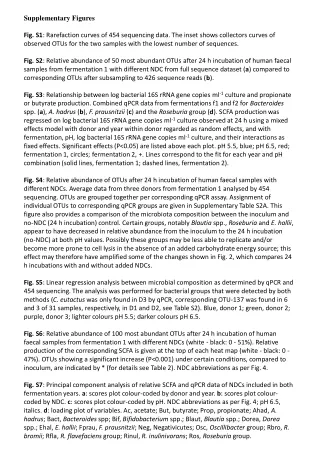
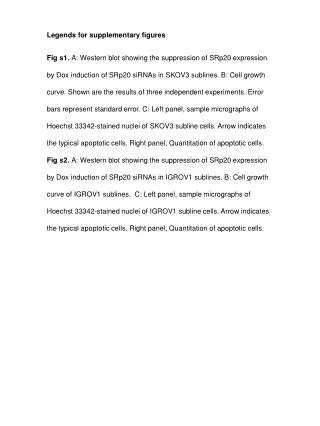
Legends for supplementary figures Fig s1. A: Western blot showing the suppression of SRp20 expression by Dox induction of SRp20 siRNAs in SKOV3 sublines. B: Cell growth curve. Shown are the results of three independent experiments. Error bars represent standard error. C: Left panel, sample micrographs of Hoechst 33342-stained nuclei of SKOV3 subline cells. Arrow indicates the typical apoptotic cells. Right panel, Quantitation of apoptotic cells. Fig s2. A: Western blot showing the suppression of SRp20 expression by Dox induction of SRp20 siRNAs in IGROV1 sublines. B: Cell growth curve of IGROV1 sublines. C: Left panel, sample micrographs of Hoechst 33342-stained nuclei of IGROV1 subline cells. Arrow indicates the typical apoptotic cells. Right panel, Quantitation of apoptotic cells.
Fig s1 A LUCsi SRp20si1 SRp20si2 - + - + - + Dox SRp20 SKOV3 67 91 % Knockdown β-actin B C Without Dox WithDox SKOV3/LUCsi SKOV3/SRp20si1 SKOV3/SRp20si2
Fig s2 A % Knockdown 47 79 B LUCsi SRp20si1 SRp20si2 - + - + Dox - + SRp20 IGROV1 β-actin Without Dox With Dox C IGROV1/LUCsi IGROV1/SRp20si1 IGROV1/SRp20si2
Table s1. Distribution of Evaluable and Total Cases by Disease Status, Number of Satisfactory Cores and Histologic Subtype in the Disease Status TMA Stained for PTB or SRp20. † Evaluable cases require at least two satisfactory cores with staining for either PTB or SRp20.
Table s2. Differential expression of PTB or SRp20 in the mucinous ovarian tumors in the Disease Status TMA Percentage within each staining category is provided in parentheses. Statistical significance was evaluated using Fisher’s exact test for data in 2 x 2 tables [43]; and the Mehta and Patel version of Fisher’s exact test for data in R x C tables [44]. † p=0.0074 for overall test; p=0.0015 for benign vs. invasive; p>0.05 for benign vs. borderline/LMP; p=0.036 for borderline/LMP vs. invasive. ‡ p=0.0036 for overall test; p=0.012 for benign vs. invasive; p>0.05 for benign vs. borderline/LMP; p=0.014 for borderline/LMP vs. invasive.
Table s3. Distribution of Evaluable and Total Cases by Tumor Stage, Number of Satisfactory Cores and Histologic Subtype in the Tumor Stage TMA Stained for PTB or SRp20 † Evaluable cases require at least two satisfactory cores with staining for either PTB or SRp20.
Table s4. Intensity of PTB or SRp20 staining in the Ovarian Cancer Stage TMA Statistical significance was evaluated using Fisher’s Exact test [43]. Staining intensity was categorized as low (score<2.5) or high (score2.5). † p=0.019 for comparison of early stage vs. advanced stage. ‡ p=0.002 for comparison of early stage vs. advanced stage.