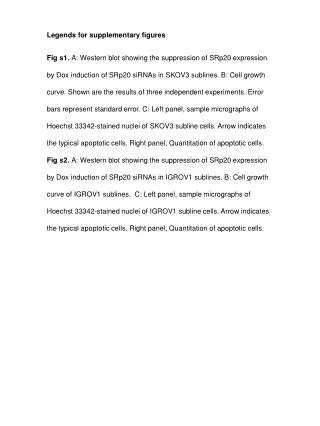
Download
1 / 9
90 likes | 224 Vues
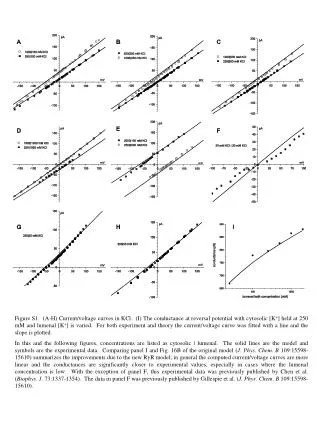
This document presents an analysis of the supplementary figures included in the PPM study, encompassing Figures 1A, 1B, 1C, and Figures 2 through 5. Detailed observations and extracted data are provided to illustrate the patterns and results observed across different datasets. Each figure is analyzed with respect to its specific metrics and variables, with an emphasis on gender-based comparisons (Female, Male). This comprehensive examination aims to contribute to a deeper understanding of the findings presented in the primary study.

E N D
ppm Figure 1A 5 6 10 X 4 3 1 2 2.8 2.6 2.4 2.2 2 1.8 1.6 1.4 1.2 1 0.8
ppm Figure 1B 8 8 8 7 12 1 X 7 16 15 14 15 13 15 10 9 9 11 4 3.8 3.6 3.4 3.2 3
ppm Figure 1C 16 9 100 X 17 17 18 8.8 8.6 8.4 8.2 8.0 7.8 7.6 7.4 7.2 7.0 6.8 6.6 6.4
Suppl. Figure 4B Female Male * * * *