Download
1 / 8
80 likes | 165 Vues
Investigating PI3Kγ subunit knockdown impact on anoikis resistance and Akt phosphorylation in breast cancer cells. Statistical analyses support the findings. Research done in vitro using shRNA and siRNA methods. 8

E N D
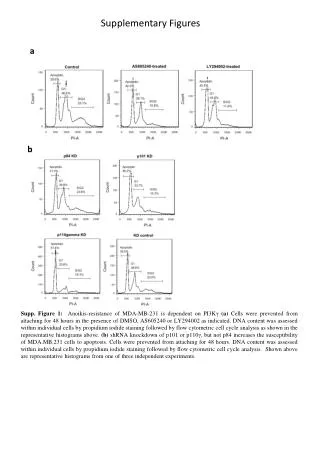
Supplementary Figures a b Supp. Figure 1: Anoikis-resistance of MDA-MB-231 is dependent on PI3Kγ(a) Cells were prevented from attaching for 48 hours in the presence of DMSO, AS605240 or LY294002 as indicated. DNA content was assessed within individual cells by propidium iodide staining followed by flow cytometric cell cycle analysis as shown in the representative histograms above. (b) shRNA knockdown of p101 or p110γ, but not p84 increases the susceptibility of MDA.MB.231 cells to apoptosis. Cells were prevented from attaching for 48 hours. DNA content was assessed within individual cells by propidium iodide staining followed by flow cytometric cell cycle analysis. Shown above are representative histograms from one of three independent experiments.
a b c Supp. Figure 2: Statistical analysis of shRNA knockdown of the subunits of PI3Kγ in MDA-MB-231 cells (a) MDA-MB-231 cells were transduced with lentiviral vectors expressing p84, p101, p110γ or scrambled shRNA. Protein knockdown was confirmed by immunoprecipitation followed by Western blot for p84. The lysate was analyzed by Western blot using actin as an input control. Western Blot densitometry was performed and the intensities of the bands from the immunoprecipitations were normalised to the input control. Statistical analysis was performed by comparing the percentage of p84 expression to that of the scrambled shRNA knockdown control cells using a repeated measures one-way ANOVA test with a post Bonferroni test, n=4 ±SEM. The p84 knockdown cells expressed significantly less p84 compared to all control cells. The expression of p84 in all other cells was not significantly different. (b) MDA-MB-231 cells were transduced with lentiviral vectors expressing p84, p101, p110γ or scrambled shRNA. Protein knockdown was confirmed by immunoprecipitation followed by Western blot for p101. The lysate was analyzed by Western blot using actin as an input control. Western Blot densitometry was performed and the intensities of the bands from the immunoprecipitations were normalised to the input control. Statistical analysis was performed by comparing the percentage of p101 expression to that of the scrambled shRNA knockdown control cells using a repeated measures one-way ANOVA test with a post Bonferroni test, n=4 ±SEM. The p101 knockdown cells expressed significantly less p101 compared to all control cells. The expression of p101 in all other cells was not significantly different. (c) MDA-MB-231 cells were transduced with lentiviral vectors expressing p84, p101, p110γ or scrambled shRNA. Protein knockdown was confirmed by immunoprecipitation followed by Western blot for p110γ. The lysate was analyzed by Western blot using actin as an input control. Western Blot densitometry was performed and the intensities of the bands from the immunoprecipitations were normalised to the input control. Statistical analysis was performed by comparing the percentage of p110γ expression to that of the scrambled shRNA knockdown control cells using a repeated measures one-way ANOVA test with a post Bonferroni test, n=4 ±SEM. The p110γ knockdown cells expressed significantly less p110γ compared to all control cells. The expression of p110γ in all other cells was not significantly different.
a b Supp. Figure 3: In vitro characterisation of shRNA knockdown of the subunits of PI3Kγ in MDA-MB-231 cells (a) 1 x 10³ cells were added to wells containing 50µl media. Cells were then allowed to proliferate at 37o C in 5% CO2. Viable cells in each well were assessed every second day by reduction of XTT (1mg/ml) added in a 50:1 ratio with PMS (1.25 mM). Absorbance at 490nm (reference 650nm) was determined using a microplate reader. Data points represent mean ± SD. Shown is one representative of 3 independent experiments. (b) 1 x 10³ cells were plated in soft agar and allowed to grow for 2 weeks and then colonies were stained with Crystal violet and counted. The results displayed are one representative of 3 independent experiments.
Suspension 0.6 0.8 0.2 0.3 Relative Intensity of PhosphoAkt compared to total Akt PhosphoAkt (S473) Total Akt + - - - - + - - - - + - - - - + KD Control p84 KD p101 KD p110γ KD Supp. Figure 4: siRNA knockdown of p101 or p110γ, but not p84 prevents suspension-activated Akt (S473) phosphorylation in MDA-MB-231 cells.Cells were serum-starved for 24 hours and then prevented from attaching for 1 hour. Cells were lysed and lysates were analyzed by Western blot for the presence of phospho-Akt (S473). Differences in phospho-Akt expression were calculated by densitometry of the blots. Shown is one representative of 3 independent experiments.
a b Supp. Figure 5: Statistical analysis of shRNA knockdown of the subunits of PI3Kγ in 4T1.2 cells (a) 4T1.2 cells were transduced with lentiviral vectors expressing p101, p110γ or GFP shRNA. Protein knockdown was confirmed by immunoprecipitation followed by Western blot for p101. The lysate was analyzed by Western blot using actin as an input control. Western Blot densitometry was performed and the intensities of the bands from the immunoprecipitations were normalised to the input control. Statistical analysis was performed by comparing the percentage of p101 expression to that of the scrambled shRNA knockdown control cells using a repeated measures one-way ANOVA test with a post Bonferroni test, n=3 ±SEM. The p101 knockdown cells expressed significantly less p101 compared to all control cells. The expression of p101 in all other cells was not significantly different. (b) 4T1.2 cells were transduced with lentiviral vectors expressing p101, p110γ or GFP shRNA. Protein knockdown was confirmed by immunoprecipitation followed by Western blot for p110γ. The lysate was analyzed by Western blot using actin as an input control. Western Blot densitometry was performed and the intensities of the bands from the immunoprecipitations were normalised to the input control. Statistical analysis was performed by comparing the percentage of p110γ expression to that of the scrambled shRNA knockdown control cells using a repeated measures one-way ANOVA test with a post Bonferroni test, n=3 ±SEM. The p110γ knockdown cells expressed significantly less p110γ compared to all control cells. The expression of p110γ in all other cells was not significantly different.
a b Supp. Figure 6: In vitro characterisation of shRNA knockdown of the subunits of PI3Kγ in 4T1.2 cells (a) 1 x 10³ cells were added to wells containing 50µl media. Cells were then allowed to proliferate at 37o C in 5% CO2. Viable cells in each well were assessed every second day by reduction of XTT (1mg/ml) added in a 50:1 ratio with PMS (1.25 mM). Absorbance at 490nm (reference 650nm) was determined using a microplate reader. Data points represent mean ±SD. Shown is one representative of 3 independent experiments (b) Cells plated in soft agar were allowed to grow for 2 weeks and then colonies were stained with Crystal violet and counted. The cells were set up in triplicate wells and the results shown are representatives of 3 independent experiments.
Supp. Figure 7: Decreased expression of p101 or p110γ inhibits primary tumor growth and spontaneous metastasis in the 4T1.2 model of breast cancer. The number of spontaneous metastatic surface lung tumors formed was normalized to the weight of the primary tumor. Shown is one representative of 3 independent experiments (n=5 mice per group). The statistical test used was a one-way ANOVA test with a post Bonferroni test.
a p110g KD GFP KD control p101 KD 0 5 0 5 0 5 min LPA PhosphoAkt (S473) Total Akt 0.5 0.8 0.6 0.6 1.0 2.2 Relative Intensity of PhosphoAkt compared to total Akt GFP KD control p101 KD b p110γ 0 5 0 5 min LPA Cadherin Relative Intensity of p110γ compared to cadherin 0.1 0.1 1.3 6.9 Supp. Figure 8: siRNA knockdown of p101 or p110γinhibits phosphorylation of Akt downstream of LPL-R signaling in 4T1.2 cells, which correlates with a prevention of p110γ translocation to the membrane. (a) Cells were serum-starved overnight and then stimulated with LPA (1μm) for 5 min. Cells were lysed and lysates were analyzed by Western blot for the presence of phospho-Akt (S473). Differences in phospho-Akt expression were calculated by densitometry of the blots. Shown is one representative of 3 independent experiments. (c) Cells were serum-starved overnight and then stimulated with LPA (1μm) for 5 min. Cells were lysed by Dounce homogenization in hypotonic buffer and membrane fractions were pelleted by centrifugation at 100,000xg for 1 hour. Membrane fractions were analyzed for the presence of p110γ by Western blot. Shown is one representative of 3 independent experiments.