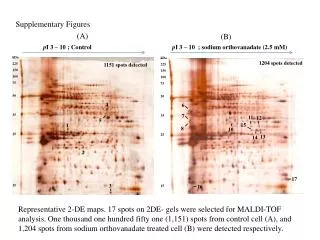
Supplementary figures
A prognostic model for lymph node negative breast cancer patients by Integrating proliferation and immune response. Supplementary figures. Supplementary Fig. S1. 73%. 7.9%. A. Supplementary Fig. S2. GSE12093. B. 23.8%. 8.7%. 4.2%. 3.7%. samples. PC1 (proliferation)

Supplementary figures
E N D
Presentation Transcript
A prognostic model for lymph node negative breast cancer patients by Integrating proliferation and immune response Supplementary figures
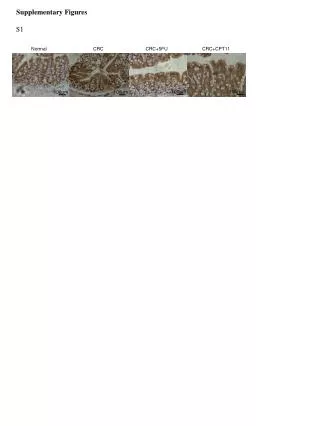
Supplementary Fig. S1 73% 7.9%
A Supplementary Fig. S2 GSE12093 B 23.8% 8.7% 4.2% 3.7% samples PC1 (proliferation) PC2 (immune response) GSE11121 GSE2034 GSE7390
Supplementary Fig. S3 A Cell cycle Cell division Chromosome segregation Cell cycle process Organelle organization Cell cycle phase Cytoskeleton organization Organelle fission Sister chromatid segregation Mitotic cell cycle M phase Nuclear division M phase of mitotic cell cycle Spindle organization Mitosis p value 0.00 0.01
Supplementary Fig. S4 B Cell activation Immune system process Response to stimulus Regulation of immune process Antigen processing, presentation Immune response Multi-organism process Response to biotic stimulus Lymphoid organ development Locomotory behavior Response to other organism Defense response Hemopoiesis Inflammatory response Taxis Leukocyte differentiation Chemotaxis Lymphocyte differentiation T cell selection p value 0.01 0.00
Supplementary Fig. S5 ER+ ER- 21% 18% 37% 37% 37% 33% 31% 51% 46% 43% 38% 40% 48% 31% 24% 27% 18% 19% Proliferation low expression of i.mean (i1) medium expression of i.mean (i2) high expression of i.mean (i3)
Supplementary Fig. S6 p = 0.001 A B C p = 0.022 p = 0.984 F D E ER- p = 0.31 p = 0.004 p = 0.912
Supplementary Fig. S7 A B C