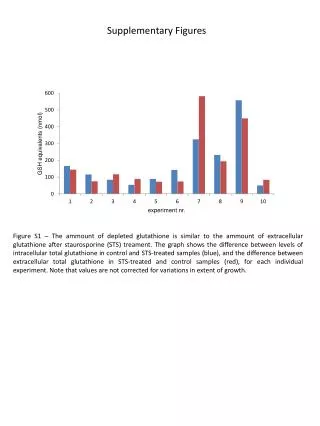
Supplementary figures
Supplementary figures. Supplementary Fig. 1. Effect of G a s on the phosphorylation of ATM following g -ray irradiation in H1299 lung cancer cells.

Supplementary figures
E N D
Presentation Transcript
Supplementary figures Supplementary Fig. 1. Effect of Gas on the phosphorylation of ATM following g-ray irradiation in H1299 lung cancer cells. H1299 lung cancer cells were transfected with HA-tagged wild type Gas (GasWT), EE-tagged GasQL, or a pcDNA3 vector (V), incubated for 24 h, and irradiated with g-rays (5 Gy). After incubation for 30 min, the expression and phosphorylation of the proteins were analyzed by western blotting. Each lane represents cells that were separately transfected, and b-actin was used as a loading control.Densitometric analysis of the phosphorylation of ATM was performed, the histograms represent the means and standard errors of at least three independent experiments. An asterisk (*) indicates a statistically significant difference from the vector-transfected control cells, and an double asterisk(**) indicates a statistically significant difference from the GasWT-transfected cells (p < 0.05, Mann–Whitney U test). Supplementary Fig. 2. Effect of Gs on the phosphorylation of ATM and downstream effectors following -ray irradiation in lung cancer cells. H1299 and A549 lung cancer cells were transfected with GasQLor a pcDNA3 vector (V), incubated for 24 h, and irradiated with g-rays (5 Gy). After incubation for 30 min, the expression and phosphorylation of p53 at Ser15 and Chk2 at Thr68 were analyzed by western blotting. Supplementary Fig. 3. Effect of 6-benzoyl cAMP on g-ray induced ATM phosphorylation in H1299 cells. H1299 cells were pretreated with 10 mM6-benzoyl cAMP (6-bnz-cAMP) or DMSO for 30 min. Then the cells were irradiated g-rays (5 Gy) and incubated 30 min before harvest and western blot analysis. Supplementary Fig. 4. Effect of g-ray irradiation on the expression of GasQLin H1299 cells. H1299 cells were transfected with GasQL or vector (V) and the transfected cells were pooled and plated into dishes at 8 h after transfection. After incubation for 24 h after transfection, the cells were irradiated with g-rays (5 Gy), and incubated 30 min before harvest and western blot analysis. Supplementary Fig. 5. Effect of okadaic acid on the radiation-induced ATM phosphorylation. The cells were pretreated with 500 nM okadaic acid (OA) or DMSO as a vehicle for 30 min, and then the cells were irradiated with -rays (5 Gy). After incubation for 30 min, the cells were harvested and analyzed by western blotting. The graph was made from the western blot band densities of Fig. 2A (empty bar: p-ATM, filled bar: p-AKT). Phosphorylated AKT (p-AKT) was analyzed as a positive control for PP2A activity. Asterisks (*) on the histograms indicate a statistically significant difference from the vector-transfected control cells; the double asterisks (**) represent a statistically significant difference from the GsQL-transfected control cells (p < 0.05, Mann–Whitney U test). Supplementary Fig. 6. Effect of Gs on PP2A B56phosphorylation. H1299 cells were transfected with GsQL or vector (V) and incubated for 24 h. siRNA against B56 (siB56) or control siRNA (C) was transfected and the cells were incubated for 48 h before the treatment. The cells were irradiated with -rays (5 Gy), incubated for 30 min, and then harvested and analyzed by western blotting. The graph was made from the western blot band densities of Fig. 2B (empty bar: p-ATM, filled bar: p-B56d). Asterisks (*) on the histograms indicate a statistically significant difference from the vector-transfected control cells; the double asterisks (**) represent a statistically significant difference from the GsQL-transfected control cells (p < 0.05, Mann–Whitney U test). Supplementary Fig. 7. Effect of PKA inhibition on the phosphorylation of PP2A B56 and ATM. H1299 cells were transfected with GsQL, vector (V), or dominant negative PKA (dnPKA) and incubated for 24 h. The cells were pretreated with 10 M H89 or DMSO as a vehicle for 30 min, and then the cells were irradiated with -rays (5 Gy). After incubation for 30 min, the cells were harvested and analyzed by western blotting. The graph was made from the western blot band densities of Fig. 2C (empty bar: p-ATM, filled bar: p-B56d). Asterisks (*) on the histograms indicate a statistically significant difference from the vector-transfected control cells (p < 0.05, Mann–Whitney U test). Supplementary Fig. 8. Effects of Gs on radiation-induced cleavage of caspase-3 and PARP in H1299 cells. H1299 cells were transfected with GsQL or vector (V) and incubated for 24 h. The cells were pretreated with 10 M KU55933 or DMSO for 30 min, irradiated with -rays (10 Gy) and incubated for 24 h. Then the cells were harvested and analyzed by western blotting. The graph was made from the western blot band densities of Fig. 3A (empty bar: cleaved PARP, filled bar: cleaved caspase 3). Asterisks (*) on the histograms indicate a statistically significant difference from the vector-transfected control cells (p < 0.05, Mann–Whitney U test).
Supplementary figures Supplementary Fig. 9. Effect of Gas on survival of g-ray irradiated cells. H1299 cells were transfected with GasQL or vector(V) and incubated for 24 h. Then the cells were irradiated with g-rays (0-8 Gy), and the cell viability was assessed after 10-14 days by clonogenicassay (open circles : vector-transfected cells, closed circles : GasQL-transfected cells). Supplementary Fig. 10. Effects of prostaglandin E2 and isoproterenol on the cleavage of caspase 3 and PARP. H1299 cells were treated with 10 M PGE2 or 1 M isoproterenol (ISO) for 30 min before irradiation with -rays (10 Gy). Cells were then incubated for 24 h before apoptosis analysis. The graph was made from the western blot band densities of Fig. 6C (empty bar: cleaved PARP, filled bar: cleaved caspase 3). Asterisks (*) on the histograms indicate a statistically significant difference from the untreated control cells (p < 0.05, Mann–Whitney U test). Supplementary Fig. 11. Effect of H-89 onthe inhibition of radiation-induced ATM phosphorylation by PGE2 and isoproterenol. The H1299 cells were pretreated with 10 mMPGE2or 1 mM isoproterenol (ISO), and 20 mM H89 for 30 min, and then the cells were irradiated with g-rays (5 Gy). After incubation for 30 min, the cells were harvested and analyzed by western blotting. Supplementary Fig. 12. Effects of prostaglandin E2 and isoproterenol on survival of g-ray irradiated cells. H1299 cells were treated with 10 M PGE2 or 1 M isoproterenol (ISO) for 30 min before irradiation with -rays (10 Gy). Then the cells were irradiated with g-rays (0-8 Gy), and the cell viability was assessed after 10-14 days by clonogenic assay (open circles; untreated control, closed circles; PGE2-treated cells, open triangles; ISO-treated cells)
Supplementary Fig. 1 p-ATM ATM * * * p-CREB P-ATM (ratio) CREB HA/EE Gas - - - - - + + - - + - + - + - - + + GasWT GasQL g-Ray β-Actin - - - - - + + - - + - + - + - - + + GasWT GasQL g-Ray
Supplementary Fig. 2 A. A549 cells B. H1299 cells p-ATM p-ATM ATM ATM p-Chk2 p-Chk2 p-p53 p-p53 p53 p-Akt p-Akt GasQL GasQL β-Actin - - - + + - + + GasQL g-Ray β-Actin - - - + + - + + GasQL g-Ray
Supplementary Fig. 3 p-ATM ATM p-CREB β-Actin - - - + + - + + 6-Bnz-cAMP g-Ray
Supplementary Fig. 4 GasQL (ratio) GasQL β-Actin + - + + - - - + GasQL g-Ray
Supplementary Fig. 5 * * * * * Relative density (ratio) * + - + + + + + - - + + - V - - V + - V - + V + + GasQL OA g-Ray
Supplementary Fig. 6 * * * Relative density (ratio) GasQL siB56d g-Ray + C - + + - V C - V + - V C + V + + + C + + + +
Supplementary Fig. 7 * * Relative density (ratio) * * * GasQL H89 dnPKA g-Ray + - - - + - - + + + - - + + - + + - + - + - + +
Supplementary Fig. 8 * * Relative density (ratio) V + - V + + V - - V - + + - - + - + GasQL KU55933 g-Ray
Supplementary Fig. 9 GasQL - + 2 Gy 4 Gy 6Gy
Supplementary Fig. 10 * Relative density (ratio) * + - + - + + - - - + - - - + - - - + PGE2 ISO g-Ray
Supplementary Fig. 11 p-ATM ATM p-CREB β-Actin ISO PGE2 H89 g-Ray - - - - - - - + + - - + + - + + - + - + - + + +
Supplementary Fig. 12 Control PGE2 ISO 2 Gy 4 Gy