Effects of BRCA1 Silencing on MDA-MB-231 Cell Proliferation and Apoptosis
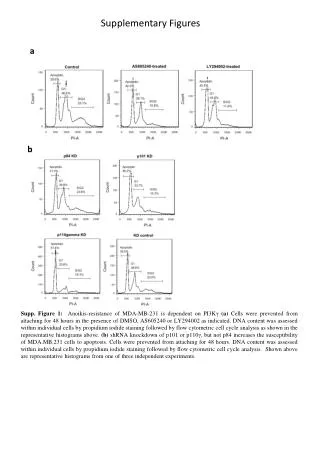
This study examines the impact of BRCA1 silencing on the proliferation and apoptosis of MDA-MB-231 breast cancer cells. Supplementary figures illustrate how different treatments, such as DEX and AG, influence cell cycle progression (S+G2/M phase) and apoptosis (SubG1 phase). The data showed significant differences in cell viability and induction of apoptosis when comparing BRCA1 silenced cells to controls. Understanding the role of BRCA1 in cancer biology can inform therapeutic strategies for breast cancer treatment.


Effects of BRCA1 Silencing on MDA-MB-231 Cell Proliferation and Apoptosis
E N D
Presentation Transcript
Supplementary Figure S1 siControl pcDNA3 siControl pcDNA3 BRCA1wt siBRCA1 BRCA1wt siBRCA1 MDA-MB-231 Proliferation A * *** 120 *** ** * *** 100 ** *** *** *** 80 *** *** cells in S+G2/M (% of control) 60 40 20 0 C DEX DEX+AG C DEX DEX+AG B Apoptosis *** * *** 120 ** ** *** ** 100 *** 80 *** cells in SubG1 (% of control) 60 40 20 0 C DEX DEX+AG C DEX DEX+AG
siControl pcDNA3 BRCA1wt siBRCA1 Supplementary Figure S2 MDA-MB-231 A B *** *** *** 140 *** 250 *** 120 200 100 150 *** 80 GRE-Luc fold induction 100 60 50 40 *** * 1 1 *** 0.5 0.5 0 C DEX C DEX *** G0S8 *** MKP-1 5 *** 10 *** *** *** 4 8 *** *** *** 3 6 mRNA fold induction mRNA fold induction 2 4 1 2 *** 0 0 C DEX C DEX C C DEX C DEX C DEX C DEX C DEX C DEX siControl siBRCA1 pcDNA3 BRCA1wt pcDNA3 BRCAwt siCtl siBRCA1 IEX-1 tPa 1.2 1.2 *** *** *** *** 1.0 1.0 0.8 0.8 *** *** *** 0.6 0.6 *** mRNA fold induction mRNA fold induction *** 0.4 0.4 *** 0.2 0.2 0 0 C DEX C DEX C DEX C DEX C DEX C DEX C DEX C DEX siControl siBRCA1 pcDNA3 BRCA1wt siControl siBRCA1 pcDNA3 BRCA1wt
Ø DEX BRCA1 wt BRCA1 wt pcDNA3 pcDNA3 Supplementary Figure S3 MDA BRCA1 silencing A B C Ø DEX si Control si BRCA1 siBRCA1 1.2 siBRCA1 siControl siControl 1 0.8 BRCA1 *** mRNA fold induction 0.6 *** GR P-Ser211 0.4 GR 0.2 Actin 0 BRCA1 GR BRCA1 overexpression D E F si Control si BRCA1 *** 5 BRCA1wt 5 pcDNA3 *** *** 3 3.5 *** *** *** 4 4 3 2.5 3 3 2.5 *** 2 6000 hGR 1B/C-Luc fold induction 2 *** hGR 1A-Luc fold induction BRCA1 2 2 2 hGR 1A-Luc fold induction 1.5 1.5 ** hGR 1B/C-Luc fold induction GR P-Ser211 ** 4000 1.5 GR mRNA levels BRCA1 overexpression condition/Ctl condition 1 GR 1 1 1 * BRCA1 mRNA levels BRCA1 overexpression condition/Ctl condition 1 ** Actin * * 2000 0 0 0.5 0.5 C DEX 0.5 C DEX 0 0 0 0 0h 12h 24h 36h 48h 0h 12h 24h 36h 48h C DEX C DEX