Download
1 / 1
10 likes | 156 Vues
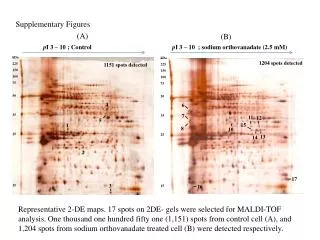
Supplementary Figures. (A). (B). kDa 225 150 100 75 50 35 25 15. p I 3 – 10 ; Control. p I 3 – 10 ; sodium orthovanadate (2.5 mM). 1151 spots detected. kDa 225 150 100 75 50 35 25 15. 1204 spots detected. 4. 6. 5. 1. 9. 7. 11. 12. 15. 8. 10. 13. 14. 2. 3.

E N D
Supplementary Figures (A) (B) kDa 225 150 100 75 50 35 25 15 pI 3 – 10 ; Control pI 3 – 10 ; sodium orthovanadate (2.5 mM) 1151 spots detected kDa 225 150 100 75 50 35 25 15 1204 spots detected 4 6 5 1 9 7 11 12 15 8 10 13 14 2 3 17 16 Representative 2-DE maps. 17 spots on 2DE- gels were selected for MALDI-TOF analysis. One thousand one hundred fifty one (1,151) spots from control cell (A), and 1,204 spots from sodium orthovanadate treated cell (B) were detected respectively.