Download
1 / 5
50 likes | 202 Vues
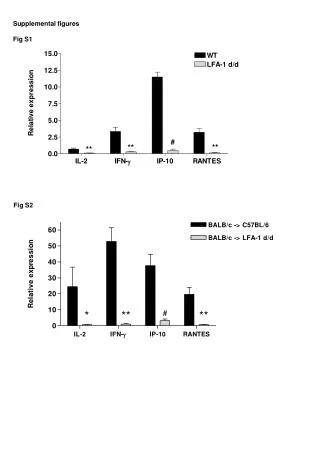
Supplementary Figures: Figures S1 and S2. Figure S1. a. a. a. a b. b.

E N D
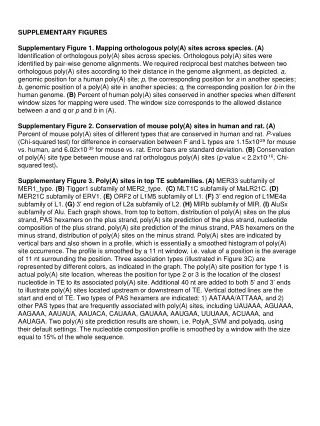
Figure S1 a a a a b b
Supplemental Figure S1: Antigen Forming Cells as a function of treatment. Female C57BL/6 mice, 6 per group, were treated on day 0 via oral gavage with 0, 3, 10, or 30µg/kg 2,3,7,8-Tetrachlorodibenzo-p-Dioxin (TCDD) in sesame oil (dose selection was based on reports in the literature indicating that 30µg/kg TCDD is well established as a dose that decreases the primary IgM response in vivo and half-log decreasing doses were selected to assess a dose-response relationship); mice were injected i.p. on day 4 with 25µg lipopolysaccharide (LPS) or phosphate buffered saline (PBS); combined treatments included mice treated on days 0 and 4 as described above. Antibody forming cells (AFC) were measured using a modified Jerne plaque assay on day 7. Data are depicted as mean ± S.E., (a) significantly different from control (p<0.05), (b) significantly different from LPS treatment (p<0.05). Insert: Timeline showing treatments, splenic tissue collection, and AFC response measurement. Day 6 is highlighted as the day on which samples for this study were obtained. Figure modified from data reported in North et. al., 2009.
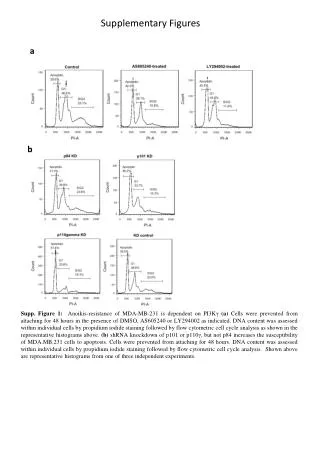
Figure S2 BLAT Search Classification Scheme Transcriptional Start Site 5’ 3’ Intron Exon 10 kb 2 kb 2 kb 10 kb > > > > > > > > > > > > > > > • Associated with a gene • Within a gene • Spans transcriptional start site and/or 5’ untranslated region • Exon • Intron • Upstream from transcriptional start site • ≤2kb • ≤10kb and >2kb • Downstream from last exon/intron • ≤2kb • ≤10kb and >2kb • >10kb from either transcriptional start site or last exon/intron • Repeat element: multiple “top” hit scores and one/several are associated with gene(s) • One site and one gene • Multiple sites in one gene • Two or more genes • Repeat element: multiple “top” hit scores and none associated with gene(s)
Supplemental Figure 2: Classification of RAM annotation based upon genomic location, as determined by BLAT search. The scheme which was used to classify annotated Regions of Altered Methylation (RAMs) according to information gleaned from BLAST-like Sequence Alignment Tool (BLAT, http://genome.ucsc.edu/cgi-bin/hgBlat) analysis based on where, in relation to a gene, the PCR product aligned Phillips and Goodman, 2009). For example, PCR products designated as 1Bii are located between 2 and 10kb upstream from an annotated gene.