Download
1 / 8
80 likes | 99 Vues
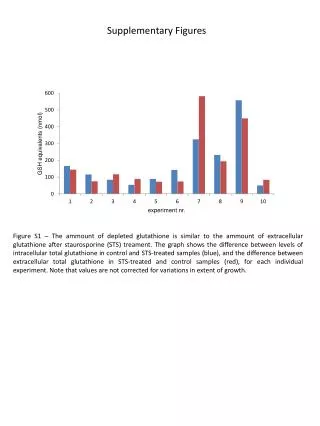
This study investigates the relationship between microbial composition and short-chain fatty acid production in human fecal samples using qPCR and 454 sequencing. Rarefaction curves, relative abundance of OTUs, and linear regression analysis are presented. Significant effects of pH and NDCs on SCFA production and bacterial groups are observed. The results provide insights into the complex dynamics of the human gut microbiota.

E N D
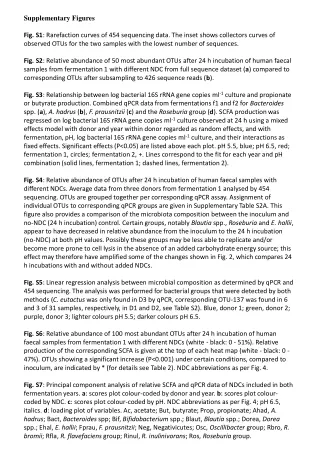
Supplementary Figures Fig. S1: Rarefaction curves of 454 sequencing data. The inset shows collectors curves of observed OTUs for the two samples with the lowest number of sequences. Fig. S2: Relative abundance of 50 most abundant OTUs after 24 h incubation of human faecal samples from fermentation 1 with different NDC from full sequence dataset (a) compared to corresponding OTUs after subsampling to 426 sequence reads (b). Fig. S3: Relationship between log bacterial 16S rRNA gene copies ml-1 culture and propionate or butyrate production. Combined qPCR data from fermentations f1 and f2 for Bacteroides spp. (a), A. hadrus (b), F. prausnitzii (c) and the Roseburia group (d). SCFA production was regressed on log bacterial 16S rRNA gene copies ml-1 culture observed at 24 h using a mixed effects model with donor and year within donor regarded as random effects, and with fermentation, pH, log bacterial 16S rRNA gene copies ml-1 culture, and their interactions as fixed effects. Significant effects (P<0.05) are listed above each plot. pH 5.5, blue; pH 6.5, red; fermentation 1, circles; fermentation 2, +. Lines correspond to the fit for each year and pH combination (solid lines, fermentation 1; dashed lines, fermentation 2). Fig. S4: Relative abundance of OTUs after 24 h incubation of human faecal samples with different NDCs. Average data from three donors from fermentation 1 analysed by 454 sequencing. OTUs are grouped together per corresponding qPCR assay. Assignment of individual OTUs to corresponding qPCR groups are given in Supplementary Table S2A. This figure also provides a comparison of the microbiota composition between the inoculum and no-NDC (24 h incubation) control. Certain groups, notably Blautia spp., Roseburia and E. hallii, appear to have decreased in relative abundance from the inoculum to the 24 h incubation (no-NDC) at both pH values. Possibly these groups may be less able to replicate and/or become more prone to cell lysis in the absence of an added carbohydrate energy source; this effect may therefore have amplified some of the changes shown in Fig. 2, which compares 24 h incubations with and without added NDCs. Fig. S5: Linear regression analysis between microbial composition as determined by qPCR and 454 sequencing. The analysis was performed for bacterial groups that were detected by both methods (C. eutactus was only found in D3 by qPCR, corresponding OTU-137 was found in 6 and 3 of 31 samples, respectively, in D1 and D2, see Table S2). Blue, donor 1; green, donor 2; purple, donor 3; lighter colours pH 5.5; darker colours pH 6.5. Fig. S6: Relative abundance of 100 most abundant OTUs after 24 h incubation of human faecal samples from fermentation 1 with different NDCs (white - black: 0 - 51%). Relative production of the corresponding SCFA is given at the top of each heat map (white - black: 0 - 47%). OTUs showing a significant increase (P<0.001) under certain conditions, compared to inoculum, are indicated by * (for details see Table 2). NDC abbreviations as per Fig. 4. Fig. S7: Principal component analysis of relative SCFA and qPCR data of NDCs included in both fermentation years. a: scores plot colour-coded by donor and year. b: scores plot colour-coded by NDC. c: scores plot colour-coded by pH. NDC abbreviations as per Fig. 4; pH 6.5, italics. d: loading plot of variables. Ac, acetate; But, butyrate; Prop, propionate; Ahad, A. hadrus; Bact, Bacteroides spp; Bif, Bifidobacterium spp.; Blaut, Blautia spp.; Dorea, Dorea spp.; Ehal, E. hallii; Fprau, F. prausnitzii; Neg, Negativicutes; Osc, Oscillibacter group; Rbro, R. bromii; Rfla, R. flavefaciens group; Rinul, R. inulinivorans; Ros, Roseburia group.
Fig. S1 Fig. S1: Rarefaction curves of 454 sequencing data. The inset shows collectors curves of observed OTUs for the two samples with the lowest number of sequences.
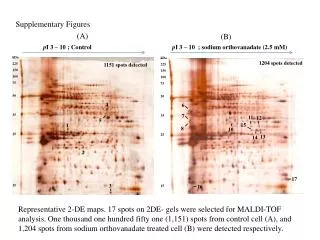
Fig. S2 a b Fig. S2: Relative abundance of 50 most abundant OTUs after 24 h incubation of human faecal samples from fermentation 1 with different NDC from full sequence dataset (a) compared to corresponding OTUs after subsampling to 426 sequence reads (b).
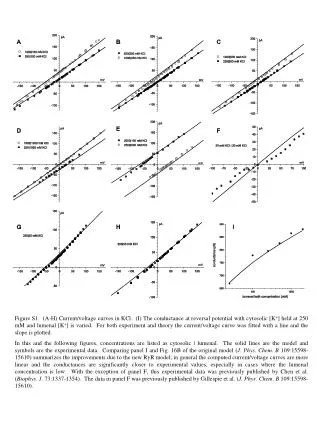
Fig. S3 a b P(pH)=0.004, P(Bacteroides spp.)=0.002 P(pH)<0.001, P(A. hadrus)<0.001, P(fermentation x A. hadrus)=0.048, P(pH x A. hadrus)=0.009 12 12 10 10 8 8 Butyrate production [mM] Propionate production [mM] 6 6 4 4 2 2 8.0 8.5 9.0 5.0 5.5 6.0 6.5 7.0 7.5 8.0 Bacteroides spp. [16S rRNA gene copies ml-1] A. hadrus [16S rRNA gene copies ml-1] c d P(pH)=0.001, P(F. prausnitzii)<0.001 P(pH)<0.001, P(Roseburia group)<0.001 12 12 10 10 8 8 Butyrate production [mM] Butyrate production [mM] 6 6 4 4 2 2 7.5 8.0 8.5 9.0 7.0 7.5 8.0 8.5 9.0 F. prausnitzii [16S rRNA gene copies ml-1] Roseburia group [16S rRNA gene copies ml-1] Fig. S3: Relationship between log bacterial 16S rRNA gene copies ml-1 culture and propionate or butyrate production. Combined qPCR data from fermentations f1 and f2 for Bacteroides spp. (a), A. hadrus (b), F. prausnitzii (c) and the Roseburia group (d). SCFA production was regressed on log bacterial 16S rRNA gene copies ml-1 culture observed at 24 h using a mixed effects model with donor and year within donor regarded as random effects, and with fermentation, pH, log bacterial 16S rRNA gene copies ml-1 culture, and their interactions as fixed effects. Significant effects (P<0.05) are listed above each plot. pH 5.5, blue; pH 6.5, red; fermentation 1, circles; fermentation 2, +. Lines correspond to the fit for each year and pH combination (solid lines, fermentation 1; dashed lines, fermentation 2).
Fig. S4 pH 5.5 other Bifidobacterium spp. Negativicutes C. eutactus Dorea spp. Blautia spp. Relative abundance of OTU group [%] A. hadrus pH 6.5 E. hallii R. inulinivorans Roseburia group Oscillibacter group R. flavefaciensgroup R. bromii F. prausnitzii Bacteroides spp. Fig. S4: Relative abundance of OTUs after 24 h incubation of human faecal samples with different NDCs. Average data from three donors from fermentation 1 analysed by 454 sequencing. OTUs are grouped together per corresponding qPCR assay. Assignment of individual OTUs to corresponding qPCR groups are given in Supplementary Table S2A. This figure also provides a comparison of the microbiota composition between the inoculum and no-NDC (24 h incubation) control. Certain groups, notably Blautia spp., Roseburia and E. hallii, appear to have decreased in relative abundance from the inoculum to the 24 h incubation (no-NDC) at both pH values. Possibly these groups may be less able to replicate and/or become more prone to cell lysis in the absence of an added carbohydrate energy source; this effect may therefore have amplified some of the changes shown in Fig. 2, which compares 24 h incubations with and without added NDCs.
Fig. S5 F. prausnitzii P<0.001 Bacteroides spp. P<0.001 R. bromii P<0.001 sequencing [%] Roseburia group P<0.001 R. flavefaciens group P<0.001 Oscillibacter group P=0.118 sequencing [%] E. hallii P<0.001 A. hadrus P<0.001 R. inulinivorans P<0.001 sequencing [%] Dorea spp. P<0.001 C. eutactus P<0.05 Blautia spp. P<0.001 sequencing [%] qPCR [%] qPCR [%] Negativicutes P<0.05 donor 1 pH 5.5donor 1 pH 6.5 donor 2 pH 5.5donor 2 pH 6.5 donor 3 pH 5.5 donor 3 pH 6.5 sequencing [%] Fig. S5: Linear regression analysis between microbial composition as determined by qPCR and 454 sequencing. The analysis was performed for bacterial groups that were detected by both methods (C. eutactus was only found in D3 by qPCR, corresponding OTU-137 was found in 6 and 3 of 31 samples, respectively, in D1 and D2, see Table S2). Blue, donor 1; green, donor 2; purple, donor 3; lighter colours pH 5.5; darker colours pH 6.5. qPCR [%]
Fig. S6 Fig. S6: Relative abundance of 100 most abundant OTUs after 24 h incubation of human faecal samples from fermentation 1 with different NDCs (white - black: 0 - 51%). Relative production of the corresponding SCFA is given at the top of each heat map (white - black: 0 - 47%). OTUs showing a significant increase (P<0.001) under certain conditions, compared to inoculum, are indicated by * (for details see Table 2). NDC abbreviations as per Fig. 4.
Fig. S7 a b donor 1, year 1 donor 2, year 1 donor 2, year 2 donor 3, year 1 donor 3, year 2 donor 4, year 2 no: no-NDC AP: apple pectin BG: barley b-glucan I-HP: long-chain inulin Rh: rhamnose c d pH 5.5 pH 6.5 Fig. S7: Principal component analysis of relative SCFA and qPCR data of NDCs included in both fermentation years. a: scores plot colour-coded by donor and year. b: scores plot colour-coded by NDC. c: scores plot colour-coded by pH. NDC abbreviations as per Fig. 4; pH 6.5, italics. d: loading plot of variables. Ac, acetate; But, butyrate; Prop, propionate; Ahad, A. hadrus; Bact, Bacteroides spp; Bif, Bifidobacterium spp.; Blaut, Blautia spp.; Dorea, Dorea spp.; Ehal, E. hallii; Fprau, F. prausnitzii; Neg, Negativicutes; Osc, Oscillibacter group; Rbro, R. bromii; Rfla, R. flavefaciens group; Rinul, R. inulinivorans; Ros, Roseburia group.