Investigating Set7/9 Role in DNA Damage Response and Cell Cycle Progression using Cell Lines
This study explores the impact of Set7/9 expression on DNA damage response and cell cycle distribution in various cell lines when treated with different genotoxic agents, shedding light on important cell cycle progression mechanisms. Furthermore, bioinformatics analysis reveals correlations affecting cancer patient survival.

Investigating Set7/9 Role in DNA Damage Response and Cell Cycle Progression using Cell Lines
E N D
Presentation Transcript
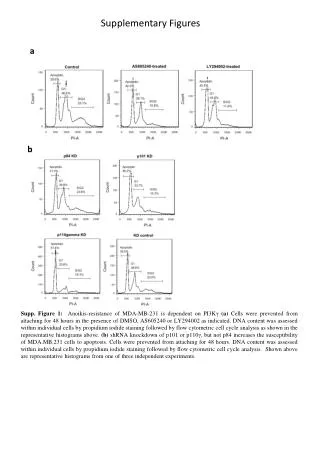
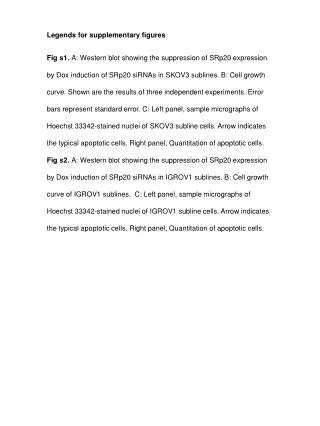
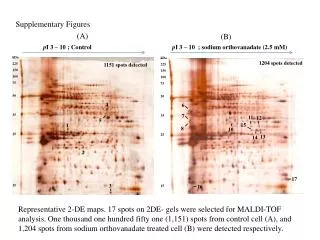
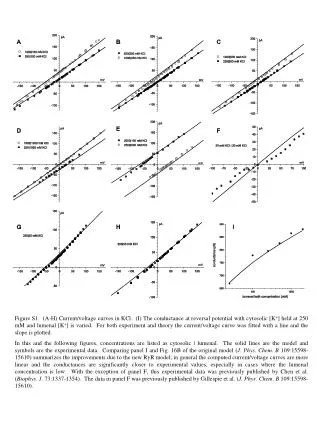
Supplementary Figures: Fig. 1, 2, and 3 show H1299 cells overexpressing Set7/9wt or H297A catalytic mutant and U2-OS, U2-OS Set7/9KD, and U2-OS Set7/9 KD cells expressing ectopic Set7/9wt or its H297A mutant. These cell lines were treated with different sources of DNA damage: doxorubicin (1), gamma- (2), or UV-irradiation (3). Following the treatment with genotoxic stress cells were harvested at different time points, stained with Propidium Iodine and analysed by FACS for their cell cycle distribution. In all the cases the lack of Set7/9 resulted in a more pronounced fraction of cells arrested in G1/S phase. Addition of the ectopically expressed Set7/9wt or H297A mutant into shRNA- Set7/9 cells resulted in different effects: Set7/9wt, but not Set7/9mut, partially restored normal DDR (DNA Damage Response) of U2-OS cells. Overexpression of Set7/9mut in H1299 cells (p53- ) despite the presence of the endogenous Set7/9 protein, also resulted in significant G1/S arrest. Collectively, these data suggest that Set7/9 is important for cell cycle progression in response to various forms of DNA Damage (DD). Fig. 4. The bioinformatics analysis demonstrates that the positive correlation between E2F1 and TP73 expression positively affects survival of the lung cancer patients (see description of the experiment provided for Fig. 5). Left panel shows that low expression of E2F1 (green line) in lung cancer patients correlates with better survival. The two other upper panels denote groups with strong positive correlation (middle) between E2F1 and TP73 expression and negative correlation (right). The lower panel shows the rate of survival for patients with positive (green line) and negative (red line) correlations. Fig. 5. A breast cancer data set shows that the negative correlation between Set7/9 and TP73 is associated with a better prognosis for survival. Left panel provides statistically significant correlation (p=0.015) between low expression of E2F1 and better survival (see description of the experiment provided for Fig. 5). Table 1. A summary of Set7/9, Cyclin E, E2F1, and TP53 expression levels in six different lung cancer cell lines and their cell cycle and apoptotic response to DNA Damage induced by doxorubicin.
H1299 cells (p53-) U2-OS cells (p53+) no treatment no treatment 14 hrs doxorubicin 24 hrs doxorubicin 24 hrs doxorubicin control Set7/9KD+Set7/9mut Set7/9KD+ Set7/9wt control Set7/9wt Set7/9mut Supplementary Fig.1
U2-OS-Set7/9 KD U2-OS control 0 hrs X-rays 16 hrs X-rays 48 hrs X-rays Supplementary Fig.2
U2-OS control Set7/9KD (LSL) 0 hrs UV 8 hrs UV 16 hrs UV Supplementary Fig.3
Positive correlation between E2F1 and TP73 expression increases survival in lung cancer, where E2F1 is an oncogene E2F1 p= 0.016 Group=1: green , strong positive correlation (0.53) between E2F1 and TP73 Group=2: red , no (or negative) correlation (-0.53) between E2F1 and TP73 GEO dataset ID: GSE36471 GEO dataset Type: lung cancer p= 0.03 GEO dataset ID: GSE36471 GEO dataset Type: lung cancer Supplementary Fig.4
Inverse correlation between SETD7 and TP73 expression in breast cancer, where E2F1 is an oncogene, increases survival E2F1 p= 0.015 Group=1: green , strong positive correlation (0.73) between SETD7 and TP73 Group=2: red , no (or negative) correlation (-0.33) between SETD7 and TP73 GEO dataset ID: GSE21653 GEO dataset Type: Breast Cancer p= 0.025 GEO dataset ID: GSE21653 GEO dataset Type: Breast Cancer Supplementary Fig.5
Supplementary Data: Table 1 name p53wt