Enhanced Current/Voltage Characterization of Ryanodine Receptor Models in Ionic Solutions
This study presents experimental and theoretical current/voltage curves for Ryanodine Receptor (RyR) models in various ionic conditions, including KCl, LiCl, NaCl, RbCl, and CsCl. The research highlights the improved linearity and closer alignment of computed conductances to experimental values due to a refined model, especially in conditions with low lumenal concentrations. Data from native and mutant RyR constructs were analyzed, and various ionic mixtures were explored to assess their effects on ionic conductance. Prior studies providing foundational data are referenced.

Enhanced Current/Voltage Characterization of Ryanodine Receptor Models in Ionic Solutions
E N D
Presentation Transcript
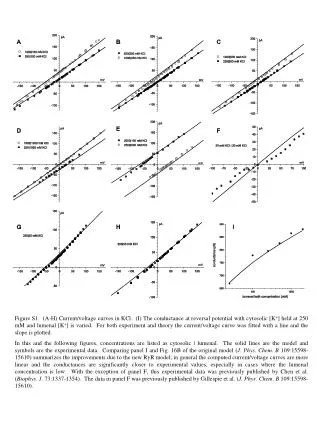
Figure S1. (A-H) Current/voltage curves in KCl. (I) The conductance at reversal potential with cytosolic [K+] held at 250 mM and lumenal [K+] is varied. For both experiment and theory the current/voltage curve was fitted with a line and the slope is plotted. In this and the following figures, concentrations are listed as cytosolic | lumenal. The solid lines are the model and symbols are the experimental data. Comparing panel I and Fig. 16B of the original model (J. Phys. Chem. B 109:15598-15610) summarizes the improvements due to the new RyR model; in general the computed current/voltage curves are more linear and the conductances are significantly closer to experimental values, especially in cases where the lumenal concentration is low. With the exception of panel F, this experimental data was previously published by Chen et al. (Biophys. J. 73:1337-1354). The data in panel F was previously published by Gillespie et al. (J. Phys. Chem. B 109:15598-15610).
Figure S2. Current/voltage curves of (A) native (WT) RyR () and the mutants D4899N (■) and E4900Q (□) and (B) the D4938N mutant in 250 mM symmetric KCl. The D4899N data was previously published by Gao et al. (Biophys. J. 79:828-840), E4900Q by Wang et al. (Biophys. J. 89:256-265), and D4938N by Xu et al. (Biophys. J. 90:443-453). Figure S3. Current/voltage curves in LiCl. The dashed line is the model result for 250 mM cytosolic and 25 mM lumenal bath concentrations (Δ). Compared to the previous model, the dashed line reproduces the data much better. This experimental data was previously published by Chen et al. (Biophys. J. 76:1346-1366). Figure S4. Current/voltage curves in NaCl. Compared to the previous model, the current/voltage curves are more linear and reproduce the data better in very asymmetric solutions. This experimental data was previously published by Chen et al. (Biophys. J. 76:1346-1366).
Figure S5. Current/voltage curves in RbCl. Compared to the previous model, the current/voltage curves are more linear and reproduce the data better in very asymmetric solutions. This experimental data was previously published by Chen et al. (Biophys. J. 76:1346-1366). Figure S6. Current/voltage curves in CsCl. Compared to the previous model, the current/voltage curves are more linear and reproduce the data better in very asymmetric solutions. This experimental data was previously published by Chen et al. (Biophys. J. 76:1346-1366). Figure S7. Mole fraction experiments at 250 mM total cation concentration in symmetric solutions. (A) NaCl and CsCl mixtures. The experimental point at mole fraction 0.6 is statistically significantly different than the point at mole fraction 1 (p < 0.05). The number of experiments is shown in parentheses. This experimental data was previously published by Gillespie et al. (J. Phys. Chem. B 109:15598-15610), but this is the first publication of this data with multiple experiments. (B) LiCl and KCl mixtures. This experimental data at these concentrations was previously published by Chen et al. (Biophys. J. 76:1346-1366). This mole fraction experiment was first performed at 210 mM total cation concentration by Lindsay et al. (J. Physiol. (London) 439:463-480).
Figure S8. Current/voltage curves in bi-ionic conditions. This experimental data was previously published by Chen et al. (Biophys. J. 76:1346-1366).
Figure S9. Current/voltage curves with divalent and monovalent cations. (A) KCl and CaCl2. (B) NaCl and CaCl2. (C) CsCl and CaCl2. (D) KCl and MgCl2. In both baths are 250 mM monovant-Cl and in the lumenal bath is 5 mM (■), 10 mM (□), and 50 mM (▲) divalent-Cl2; or the cytosolic bath contains 250 mM cytosolic monovant-Cl while the lumenal bath contains 25 mM lumenal divalent-Cl2 (Δ). Current/voltage curves of (E) the D4899N (■) and E4900Q (□) mutants and (F) the D4938N mutant in 250 mM symmetric KCl and 10 mM lumenal CaCl2. Compared to the previous model, the current/voltage curves of Cs+/Ca2+ mixtures and Na+/Ca2+ mixture reproduce the data better. The data in panels A–D were first published by Chen et al. (J. Phys. Chem. B 107:9139-9145). The D4899N data (panel E) was previously published by Gao et al. (Biophys. J. 79:828-840), E4900Q (panel E) by Wang et al. (Biophys. J. 89:256-265), and D4938N (panel F) by Xu et al. (Biophys. J. 90:443-453).