Enhancing Classroom Learning Through Effective Visualization Tools
This resource explores the critical role of visualization tools in geoscience education, emphasizing their potential to improve student learning and engagement. It highlights the importance of selecting appropriate visualizations that appeal to students' emotions and cognitive skills. Key considerations include understanding students’ prior knowledge, crafting effective educational visuals, and ensuring clarity without unnecessary complexity. The guide also addresses the common challenges educators face and provides strategies to align visualization tools with intended learning outcomes.

Enhancing Classroom Learning Through Effective Visualization Tools
E N D
Presentation Transcript
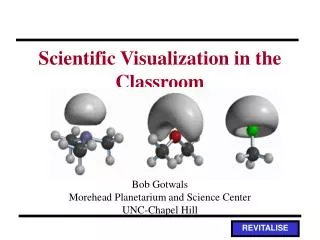
Visualization Tools for the Classroom Karin Kirk, Cathy Manduca, Carol Ormand Science Education Resource CenterCarleton College theScience Education Resource CenteratCarleton College • SERC
Overall outline • Intro and think-pair-share • The Take Home Message • What makes a good visualization? • How visualizations are used • What faculty are looking for • Barriers to use • Affective impacts of visualizations • SERC websites: visualizations and tools for educators
Introduction Geoscience is a highly visual field, and effective use of visual tools can enhance student learning, appeal to students’ emotions and help them acquire skills for interpreting visual information. This requires: • The appropriate visual tool • Applying it effectively in the classroom
Pedagogic reasons to use visualizations • Permits observation of the unobservable • Renderings showing 3 dimensions or changes over time make complex processes much easier to understand (reduces cognitive load) • Visualizations allow students to construct their own mental images that stick with them • They’re cool!
Think-Pair-Share If you are a teacher using visualization tools: How do you want to use visualizations in the classroom? What type of visualization tools do you need? If you are a developer of visualization tools: Imagine your visualization tool being used in the classroom. How is it being used? • Identify • common similarities • gaps between developers and educators
Big take home message: students don’t see what you see • Geoscientists (you) have sophisticated spatial reasoning skills • Mental models of processes • Familiarity with reading maps, contours, scales • Geography knowledge • Looking and seeing are learned skills. • The knowledge you bring to the image affects your experience with it. • All of this improves with guided practice. Frequency distribution of particles in the atmosphere by size as developed by Whitby (1978). Classroom scenario described by Perry Samson, Univ. Michigan.
What do you see illustrated in this diagram? • How much of what you see is a function of geoscience that you have learned?
So, what makes an effective visualization for teaching? http://serc.carleton.edu/NAGTWorkshops/visualization
1. The same things that work well in designing any educational activity work well in designing or selecting a visualization. Start with the intended outcome and goals. What you are trying to accomplish with the visualization? What are you trying to teach?What do you want the students to learn?
2. Students don't always see what faculty are seeing when viewing a visualization.Just as in other aspects of learning, what students see and learn is built on what they already know. Understanding what students know and see can be addressed on four levels: • Cognitive: what do students focus on in a visualization? • Educational: how does the visualization build on what they already know? • Geoscience: how do students understand and interpret the processes that are represented? • Affective: how does the visualization make students feel?
2. (continued) How can we better align what we want students to see with what they are actually seeing? • Map the structure and content of the information to be conveyed on the structure and content of the diagram. • Use extra-pictorial devices like arrows and guidelines unambiguously. • Craft diagram to explain, not just show. • Check to see if students learn what is intended (Tversky, On the Cutting Edge workshop)
3. Simple is usually* better.The power of visualizations comes from their ability to clarify relationships rather than from reproducing exactly the natural world. Thus, a design which emphasizes the desired relationships or information is likely to be more successful than one that makes every effort to be realistic. Students can become confused when elements of a diagram closely resemble the actual entity they represent in the real world (Uttal et al., 2006). *Over-simplification can create misconceptions *Realism is helpful is some cases
Mazur, in progress: mazur-www.harvard.edu Mayer, 2001: Multimedia Learning
4. Context is important and is easily lost.Effective visualizations maintain the contextual relationships between the different parts of the visualization and between the visualization and whatever it represents. For example, when a series of diagrams are used to explain a process, it is important to keep the student aware of how each step in the progression relates to the overall process.
5. Visualizations are most effective if their organization reflects the mental organization that the student is creating. For example, if students create a series of still images in their mind to represent a geologic process, a series of still images will be most effective in conveying information. Similarly, if students create a mental movie, an animation may be more effective. (Tversky et al., 2002 )
6. Guidance helps.Visualizations present a large number of relationships at a single time. Visual or textual clues can focus attention on meaningful items or guide the learner through the visualization in a particular order.
What are different ways faculty use visualizations in the classroom? • Show and tell in lecture, illustrated example • Interactive lecture – a visualization is paired with a think-pair-share, minute paper, concept test, or “clicker” question. • Lab activity – students are guided through an activity where they interact with a visualization tool to look at data sets and explore spatial or temporal relationships • Independent exploration – students follow instructions on their own, often guided by questions provided by the instructor • Reflection/synthesis – students create a drawing or concept sketch • Assessment – visualization is part of a problem set or exam, especially after they have already seen something similar in class or lab.
What are faculty looking for when selecting a visualization tool? • Fits the learning goals of their course • Is consistent with the level of expertise of the students • Communicates an important point • Helps students overcome common areas of difficulty • Allows students to work with data and manipulate the imagery to create a deeper understanding • Educational value of visualization is greater than the trouble to set it up and run it
Factors Affecting Use Faculty like... • Browser-friendly • Familiar file formats • Ability to preview before committing to download, or better yet, run right from the web. • Having control over scale, variables, parameters • Intuitive; the students will likely be able to jump right in • Data and imagery that are available for re-use • Free Faculty tend to avoid... • Tools that require a special platform • Alphabet soup of file formats • Big commitment of downloading, installing, and fiddling, prior to assessing if this is the right tool for the job. • Inflexible • Requires intervention from instructor (i.e. ignore that part, don’t forget that the colors are backwards...) • Requires proprietary data • Expensive
Affective impacts of using visualizations • Illustrations elicit emotional response (i.e. Al Gore’s CO2 graph) • Using visual tools provides a welcome break from traditional lecture • Interactive nature lets students be in control (Reeve and Jang, 2006) • Allows students to explore, hypothesize, play • Students can see their effect on a larger picture (i.e. their own data set as part of larger data series) • Today’s students are comfortable with technical media; many will appreciate activities that take advantage of technology. • However, don’t spoil the fun with overly complex, intimidating, buggy, or counterintuitive interfaces.
SERC has tools to help you • Collections of visualizations for teaching • Collections of activities using visualizations • Recommended readings and an annotated bibliography • Workshop program • Links to related sites across the SERC websites (Google Earth, Teaching with Visualizations) • Visualization collections embedded into many geoscience topics • Share your favorite visualization or activity http://serc.carleton.edu/NAGTWorkshops/visualization