Download
1 / 34
370 likes | 560 Vues
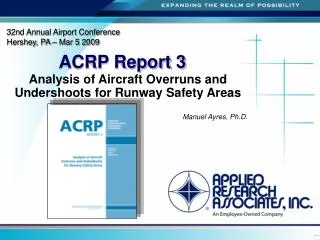
ACRP 4-01. Aircraft Overrun and Undershoot Analysis for Runway Safety Areas Manuel Ayres, Ph.D. Summary. Objective Approach Functional Hazard Analysis Accident/Incident Database Normal Operations Data Normalization Risk Models Analysis Software. ACRP 4-01 Project.

E N D
ACRP 4-01 Aircraft Overrun and Undershoot Analysis for Runway Safety Areas Manuel Ayres, Ph.D.
Summary • Objective • Approach • Functional Hazard Analysis • Accident/Incident Database • Normal Operations Data • Normalization • Risk Models • Analysis Software
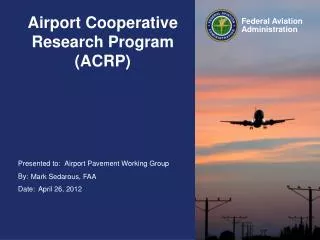
ACRP 4-01 Project • Airport Cooperative Research Program (ACRP) • Objective: develop near-term practical solutions to problems faced by airports • Industry-driven program focused on applied research to airport operators • Authorized in December 2003 as part of the Vision 100-Century of Aviation Reauthorization Act • Oct 2005, FAA executed a contract with the National Academies (through TRB) to serve as manager of the ACRP • Program oversight and governance are provided by representatives of airport operating agencies http://www.trb.org/crp/acrp/acrp.asp
Project Team • ARA Team • ARA • Jim Hall – PI • Manuel Ayres – PM • Rich Speir • Hamid Shirazi • Tara Puzin • Other • Loughborough University • David Pitfield • Robert Caves • Andrew Appleyard • Derek Wong • ESR-Technology • Mark Eddowes • ACRP Staff Responsible • Michael R. Salamone, CM
Background • 71% of Accidents occur during landing and take-off • 41% of onboard and 3rd party fatalities • Landing overruns, landing undershoots, take-off overruns, and crashes after take-off • Runway safety areas (RSA) are prescriptive resulting in ‘averaged’ degrees of protection • Current RSA dimensions based on studies by FAA in the 80s
Reason’s Swiss Cheese Holes are active failures & latent conditions Accidents/ Incidents The cheese is moving! Successive layers of defenses, barriers and Safeguards Hazards
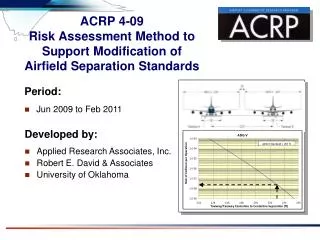
Objective of ACRP 4-01 • Collect historical information related to overrun and undershoot accidents and incidents • Develop risk models for overrun and undershoot events • Evaluate risks associated with standard and non-standard RSA dimensions • Develop prototype software for overrun and undershoot risk analysis
Functional Hazard Analysis • Formal and systematic process for the identification of hazards (similar to hazard and operability (“HAZOP”) studies) • Gathering together a multi-disciplinary team • Determine relevant causal factors of overrun and undershoot accidents and hazards to aircraft associated with airport operations • Support the data collection and development of risk models
Functional Hazard Analysis • Categories • Aircraft characteristics and system faults • Airport characteristics and system faults • Weather characteristics • Pilot related issues
Landing Overruns – Major Factors • Weather • Tailwind • Cross wind • Visibility • Ceiling • Airport • Surface contaminants and friction (water, snow, ice, rubber deposits) • Pilot • Landing long • Landing high • Landing fast • Aircraft • System faults
Takeoff Overruns – Major Factors • Weather • Tailwind • Airport • Surface contaminants and friction (water, snow, ice, rubber deposits) • Pilot • Delay to abort • Aircraft • System or component malfunction require to abort takeoff
Landing Undershoots – Major Factors • Weather • Visibility • Ceiling • Wind variations (gusts, shear) • Airport • Surface contaminants and friction (water, snow, ice, rubber deposits) • Pilot • Visual illusion
Visual Illusion A B • Runway dimensions • Runway and terrain slope • Intensity of runway lighting • Visibility • Wet runway • Crosswind Source: David Newman and Flight Safety Foundation
Other Factors • Wind variations (gusts, shear) • Temperature, Altitude • Landing/Takeoff Distance (LDA vs. LDR; ASDA vs. ASDR) • Slopes (longitudinal and transverse) • Runway profile • System faults • Unstabilized approach • “Press-on-itis” • Incorrect (delay) application of thrust reverse, spoilers and brakes • ‘Over-consideration’ for comfort • Incorrect interpretation of reported operation conditions • Selecting wrong runway • Weight • Availability of navigational aids • Approach too low • Attempt to land too close to arrival end of the runway
Database Sources • NTSB • Accident Database & Synopses (Accidents and Incidents) • FAA • Aviation Safety Reporting System - ASRS (Incidents) • Accident/Incident Data System - AIDS (Incidents) • Transportation Safety Board of Canada (Accidents & Incidents) • UK CAA-Safety Regulation Group (SRG) Mandatory Occurrence Reporting Scheme (MORS) Database (Accidents & Incidents) • Australian Transport Safety Bureau (Accidents & Incidents)
Consequences Accidents Incidents DATA Collection Cost of Investigation & Availability of Information # Reported Events Probability and # of Events
Database Filters • Both accidents and incidents • North American, Western European, Australia, New Zealand • Fixed-wing • Part 121, 125, 129, 135 and Part 91F Operations • Aircraft with MTOW > 12500 lb • Excluded single engine and piston engine aircraft
Access Database • ~ 300 fields/record • Basic Data • Aircraft Data • Airport Data • Consequences • Details • Flight Data • Obstacles • Terrain • Injuries • Weather • Wreckage
Accident Location y x Wreckage Location
Normal Operations Data • Approach • Evaluate number of operations that experience certain factors benignly, singly and in combination. • Generate risk ratios and quantify the importance of risk factors • Source: FAA's Enhanced Traffic Management System Counts (ETMSC) & a National Oceanic and Atmospheric Administration's (NOAA) weather database
Normal Operations Data • NOD was sampled from a total of 78 selected airports • Sampled airports account for 48,924,040 operations from 2000 to 2005 inclusive (25.5% of all relevant traffic in the period) • Flights on the first day of February, May, August and November of 2002, 2003 and 2004 were sampled to constitute the NOD sample • After eliminating incompatible traffic, the final NOD sample consists of 24,240 flights
Normalization • Small pool of relevant data available • Data from different airports, operation conditions, aircraft performance • Comparing apples and apples • Only raw distances between the final wreckage location and the runway end have been used to develop current RSA recommendations • Assume an infinitely long hard surface runway
Normalization Procedures • Correcting (overrun and undershoot) distances for • Temperature • Altitude • Slope (when available) • Aircraft performance • Landing/Takeoff distance available • Terrain (type, slope)
Risk Models • Frequency • Location • Severity (Injuries, Cost) • Landing overrun • Takeoff overrun • Landing undershoot
Frequency Models • Probability = Ni/a / Nn (under certain operation conditions) • P{Accident_Occurrence} is the probability (0-100%) of an accident type occur given certain operational conditions. • Xi = f(runway friction, ceiling, visibility, crosswind, tailwind, etc.)
Location Model - Overruns Stop Location Probability Distribution RSA x y
Location Model - Overruns Decreasing Probability RSA Frequency Contours
Location Model - Undershoots Touchdown Location Probability Distribution RSA x y
Prototype Analysis Software • User-friendly application in Visual Basic for MS Excel • Input operation conditions • Normalize the data • Estimate risks • Denormalize data
Contact Info • ARA Jim Hall, 601-629-6165 jhall@ara.com Manuel Ayres 410-540-9949 mayres@ara.com • ACRP Staff Michael R. Salamone (202) 334-1268 msalamone@nas.edu