Download
1 / 15
150 likes | 232 Vues
Explore the classification and sources of uncertainties in design, operations, and post-mortems. Learn about random variables, probability distributions, and safety mechanisms to reduce highway fatalities.

E N D
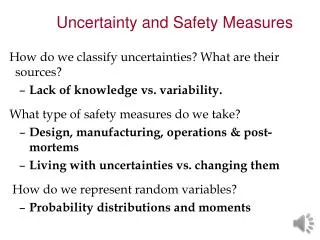
Uncertainty and Safety Measures How do we classify uncertainties? What are their sources? • Lack of knowledge vs. variability. What type of safety measures do we take? • Design, manufacturing, operations & post-mortems • Living with uncertainties vs. changing them How do we represent random variables? • Probability distributions and moments
Reading assignment Oberkmapf et al. “Error and uncertainty in modeling and simulation”, Reliability Engineering and System Safety, 75, 333-357,2002 S-K Choi, RV Grandhi, and RA Canfield, Reliability-based structural design, Springer 2007. Available on-line from UF library http://www.springerlink.com/content/w62672/#section=320007&page=1 Source: www.library.veryhelpful.co.uk/ Page11.htm
Classification of uncertainties Aleatory uncertainty: Inherent variability • Example: What does regular unleaded cost in Gainesville today? Epistemic uncertainty Lack of knowledge • Example: What will be the average cost of regular unleaded January 1, 2013? Distinction is not absolute Knowledge often reduces variability • Example: Gas station A averages 5 cents more than city average while Gas station B – 2 cents less. Scatter reduced when measured from station average! Source: http://www.ucan.org/News/UnionTrib/
A slightly differentuncertainty classification British Airways 737-400 . Distinction between Acknowledged and Unacknowledged errors
Safety measures Design: Conservative loads and material properties, accurate models, certification of design Manufacture: Quality control, oversight by regulatory agency Operation: Licensing of operators, maintenance and inspections Post-mortem: Accident investigations
Many players reduce uncertainty in aircraft. The federal government (e.g. NASA) invests in developing more accurate models and measurement techniques. Boeing invests in higher fidelity simulations and high accuracy manufacturing. Airlines invest in maintenance and inspections. FAA invests in certification of aircraft & pilots. NTSB, FAA and NASA fund accident investigations.
Representation of uncertainty Random variables: Variables that can take multiple values with probability assigned to each value Representation of random variables • Probability distribution function (PDF) • Cumulative distribution function (CDF) • Moments: Mean, variance, standard deviation, coefficient of variance (COV)
Probability density function • Probability density function is for continuous variables that the probability of a single value is zero. For example, with the function rand, the probability of getting exactly 0.5 is zero. • If the variable is discrete, it is like concentrated masses. For example, when you toss a single die, the probability of getting 6 is 1/6; so is the probability of getting 3. • If you toss a pair dice the probability of getting twelve (two sixes) is 1/36, while the probability of getting 3 is 1/18.
Histograms • Probability density functions have to be inferred from finite samples. First step is histogram. z=randn(1,50)+10; hist(z,8); z=randn(1,500000)+10; hist(z,8)
Number of boxes • Sample of 500 from randn
Histograms and PDF How do you estimate the PDF from a histogram? SOURCE: http://schools.sd68.bc.ca/ed611/akerley/question.jpg
Cumulative distribution function Integral of PDF X = [-3:0.1:3]; p=normcdf(x,0,1) plot(x,p)
Moments • Mean • Variance • Standard deviation • Coefficient of variation • Skewness
problems • List at least six safety measures or uncertainty reduction mechanisms used to reduce highway fatalities of automobile drivers. • Give examples of aleatory and epistemic uncertainty faced by car designers who want to ensure the safety of drivers. 3. Let x be a standard normal variable N(0,1). Calculate the mean and standard deviation of sin(x) Source: Smithsonian Institution Number: 2004-57325