Download
1 / 1
10 likes | 42 Vues
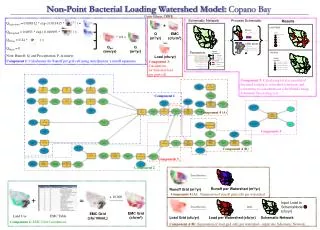
Utilizing a Watershed Model to Calculate Bacterial Load Impact on Copano Bay. Analyzing Non-Point Bacterial Loading from Various Land Use Components. Implementing Decay Coefficient, Runoff, and Precipitation Factors for Accurate Results.

E N D
Decay Loadpassed = Loadreceived e-kt * P Q (m3/yr) EMC (cfu/m3) P Watershed Junction Copano Bay Load (cfu/yr) Land to Streams Streams Streams to Bay Component 3: Calculations for bacterial load per grid cell Non-Point Bacterial Loading Watershed Model: Copano BayCarrie Gibson, CRWR Schematic Network Process Schematic Results QAgriculture = 0.008312 * exp ( 0.011415 * ) = P cfu/100mL QRangeland = 0.0053 * exp ( 0.010993 * ) = * 0.9 = QUrban = 0.24 * ) = = CSTR Model c = L / (Q + kV) c = concentration in bay (cfu/m3) L = Bacterial Loading entering bay (cfu/year) Qtot (mm/yr) Q (m3/yr) QWater = 0 Parameters cfu/year Note: Runoff, Q, and Precipitation, P, in mm/yr Bacterial Loading per Watershed (cfu/year), L Decay Coefficient, k (day-1) Volume of Copano Bay, V (m3) Cumulative Runoff, Q (m3/yr) Component 1: Calculations for Runoff per grid cell using Ann Quenzer’s runoff equations. Decay Coefficient, k (day-1) Travel Time, t (days) Decay Coefficient, k (day-1) Travel Time, t (days) Component 5: Calculating total accumulated bacterial loading to watershed (cfu/year) and converting to concentrations (cfu/100mL) using Schematic Processing tool Component 1 Component 4 (A) Component 5 Component 4 (B) Component 3 Component 2 Zonal Statistics Runoff per Watershed (m3/yr) Runoff Grid (m3/yr) Component 4 (A): Summation of runoff grid cells per watershed x 10,000 + = Input Load to SchemaNode (cfu/yr) Zonal Statistics Input EMC Grid (cfu/m3) EMC Grid (cfu/100mL) Land Use EMC Table Load Grid (cfu/yr) Load per Watershed (cfu/yr) Schematic Network Component 2: EMC Grid Calculations Component 4 (B): Summation of load grid cells per watershed - input into Schematic Network